Summary
Bitcoin climb
On Tuesday, bitcoin’s price climbed back above the $57k level and finished its daily candle +$1,303.
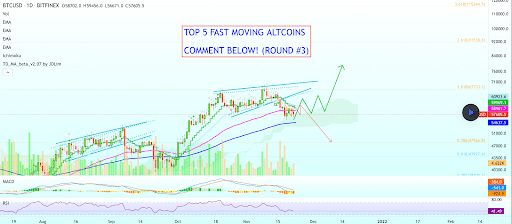
The BTC/USD 1D chart below from AlanSantana shows the key fib levels that traders are likely to see shortly to the upside or downside on the daily timescale. BTC’s price is currently consolidating right in between to fib levels.
The fibonacci targets for bitcoin bulls to the upside are the 1.618 [$67,733.1] and the 2.618 [$91,538.8].
If bears are successful at this pivotal level, their targets to the downside are 0.786 [$47,926.8] and a secondary target of 0.618 [$43,927.4].

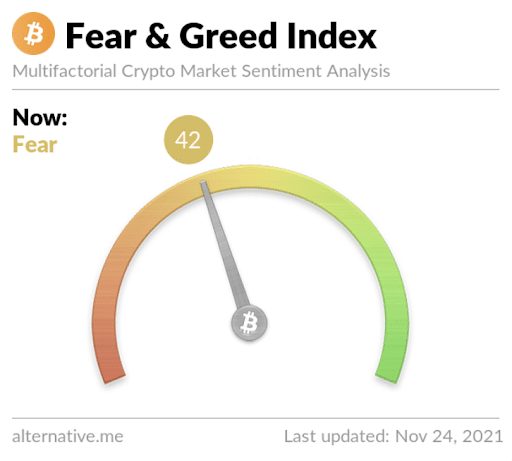
The Fear and Greed Index is 42 Fear and +9 points from Tuesday’s reading of 33 Fear.

Bitcoin’s price is trading above all important moving averages, at the time of writing; 50-Day [$56,010] 100-Day [$48,915] 200-Day [$48,543.14].
Bitcoin also managed to backtest $57,485 with candle close confirmation. BTC is back inside the zone of inflection on the 4hr time frame with classic bullish divergence, at the time of writing.
BTC’s 24 hour price range is $55,865-$57,954 and its 7 day price range is $55,861-$60,982. Bitcoin’s 52 week price range is $16,592-$69,044.
The price of bitcoin on this date last year was $19,091.
The average price of BTC for the last 30 days is $61,697.
Bitcoin [+2.31%] closed its daily candle worth $57,602 and in green figures for the first time since Saturday [November 20th].
Ethereum analysis
Ether’s price broke a streak of two straight daily candle closes in red figures on Tuesday and finished the day +$253.93.
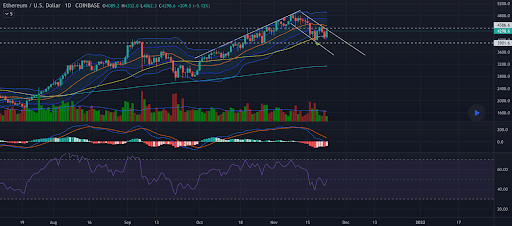
The ETH/USD 1D chart below from ritubpant shows Ether’s price painting a bearish flag. The $4k level hasn’t really been breached by bearish Ether traders yet and if bulls can continue to get some bullish divergence to form, their next target is back to the $4,5k level yet again.
Conversely, bears are looking to send ETH’s price down inside of the channel to the downside by breaking the $3,9k level finally and testing $3,6k.

Ether’s price is also trading above all important moving averages, at the time of writing; 50-Day [$3,852.24] 100-Day [$3,336.86] 200-Day [$2,826.93].
ETH’s 24 hour price range is $4,051-$4,382 and its 7 day price range is $3,981-$4,443. Ether’s 52 week price range is $501.45-$4,878.
Ether’s price on this date in 2020 was $602.67.
The average price of ETH for the last 30 days is $4,399.
Ether [+6.21%] closed its daily candle on Tuesday worth $4,340.45.
Crypto.com Coin ATH
Crypto.com Coin’s price made a new all-time high (ATH) on Tuesday of $.906.
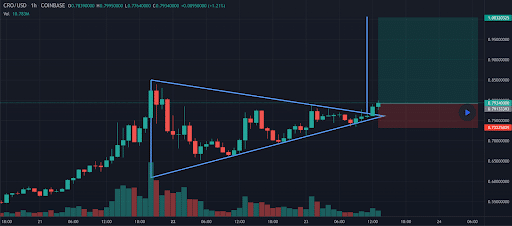
The CRO/USD 1hr chart below from Cryptobees_buzz shows CRO’s breakout of a symmetrical triangle with a bullish target of $1 overhead.
Bears on the other side of the coin are hoping to send CRO’s price back inside the symmetrical triangle. If they succeed, the next target for CRO bears will be to test its demand line at $.75.

Crypto.com Coin’s 24 hour price range is $.718-$.906 and its 7 day price range is $.382-$.906. CRO’S 52 week price range is $.054-$.906.
Crypto.com Coin’s price on this date last year was $.072.
The average price for CRO over the last 30 days is $.37.
Crypto.com Coin [+21.8%] closed its daily candle on Tuesday worth $.883 and in green figures for a fifth straight day.


