Summary
Bitcoin Analysis
Bitcoin’s price closed it’s daily candle on Tuesday in green figures for the third straight day and +$67.4.
The BTC/USD 1W chart below from Rgodsey07 poses the question of whether BTC’s price doubled-topped on the weekly timescale.
Traders will note that BTC’s price closed below the .786 [$55,520.28] last week. If bearish BTC market participants have their way, they’ll send bitcoin’s price down to test the .618 [$44,487.84] once more.

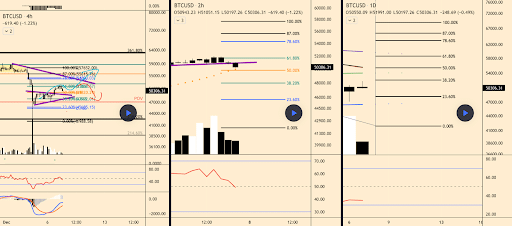
For further perspective, traders can look at three other timescales chartered by lordxclau.
Bitcoin bulls are trying to send BTC’s price back to the .618 [$52,460] on the 4hr timescale with a secondary target overhead of .786 [$54,300].
Conversely, bitcoin bears are attempting to send BTC’s price back down to a 50% fibonacci retracement [$49,818] with a secondary target of 38.2% [$47,122].

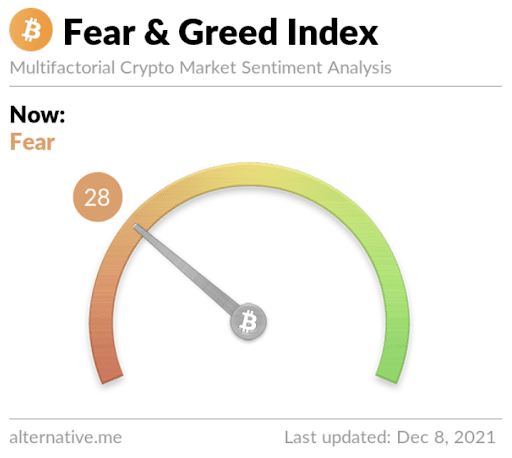
The Fear and Greed Index is 28 Fear and down 3 points from yesterday’s reading of 25 Extreme Fear.

BTC’s 24 hour price range is $50,173-$51,943 and its 7 day price range is $46,633-$58,612. Bitcoin’s 52 week price range is $17,764-$69,044.
The price of bitcoin on this date last year was $18,336.
The average price of BTC for the last 30 days is $58,622.
Bitcoin [+0.13%] closed its daily candle worth $50,634 on Tuesday.
Ethereum Analysis
Ether’s price followed a number of other alt coins lower on Tuesday and finished it’s daily candle -$45.55.
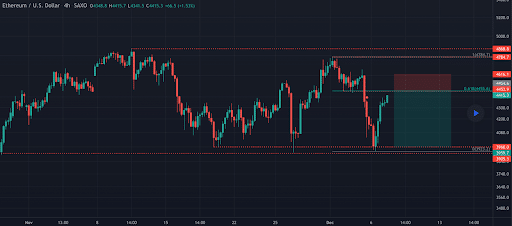
The ETH/USD 4HR chart below from Saxo shows Ether’s price in a large range currently between the 0 [$3,923.2] and .618 [$4,455.6].

ETH’s 24 hour price range is $4,270-$4,427 and its 7 day price range is $3,828-$4,770. Ether’s 52 week price range is $541.28-$4,770.
The price of ETH on this date in 2020 was $592.39.
The average price of ETH for the last 30 days is $4,401.
Ether [-1.05%] closed its daily candle worth $4,307.11 on Tuesday and in red figures for the first time in three days.
Polygon Analysis
MATIC’s price finished Tuesday’s daily candle +$.07 and in green figures for the third straight day.
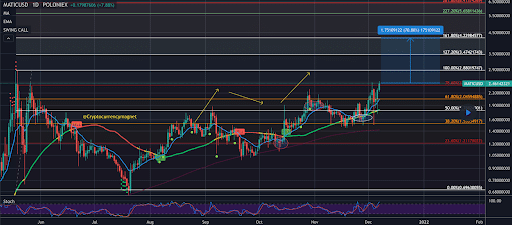
The MATIC/USD 1D chart below from TradingShot details the most important support levels and overhead resistances within its current channel and also outside of it.
Bullish MATIC traders are attempting to reclaim the 78.60% fib level [$2.43] and send Polygon’s price back to the 100% fib level [$2.88].
Participants shorting MATIC are seeking to push its price below the 61.8% fib level [$2.04] and then on to a secondary target of $1.78 and a 50% fibonacci retracement.

Polygon’s 24 hour price range is $2.2-$2.5 and its 7 day price range is $1.76-$2.5. MATIC’s 52 week price range is $.014-$2.62.
Polygon’s price on this date last year was $.019.
The average price for MATIC over the last 30 days is $1.80.
MATIC [+2.99%] closed its daily candle worth $2.34 on Tuesday.


