Bitcoin’s price action on Wednesday was further confirmation of Tuesday’s bullish engulfing candle and finished +$1,166.
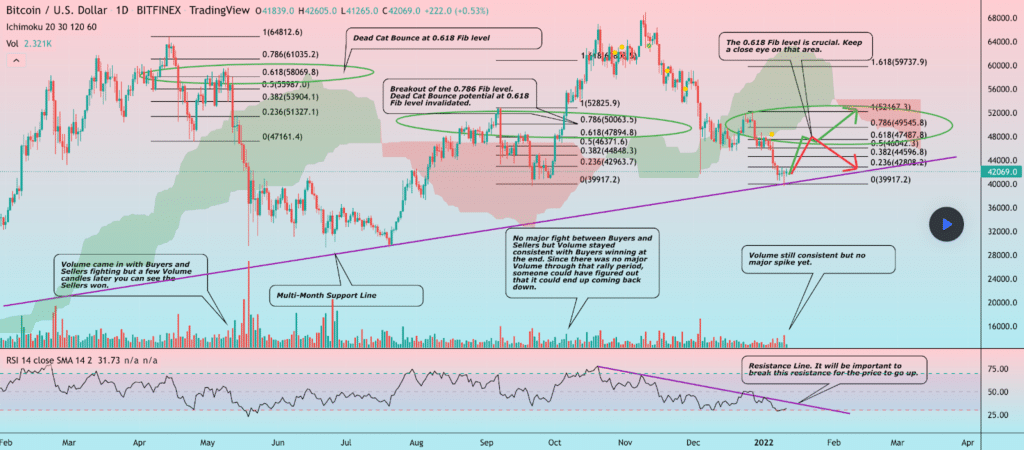
The BTC/USD 1D chart below from CRYPTOPICKK shows that bitcoin’s price is currently trading between the 0.236 fib level [$42,808.2] and the 0.382 fib level [$44,596.8].
With bullish traders currently in control of the short term momentum after Tuesday’s bullish engulfing candle, bullish traders are hoping to break the 0.382 fib and head for a secondary target of 0.5 [$46,042.3]. If bullish BTC traders are able to crack the 0.5 fib level a third target is the 0.618 [$47,487.8].
Bearish BTC traders conversely are seeking to break bitcoin’s long term trendline on the daily timescale and retest 0 [$39,917.2].
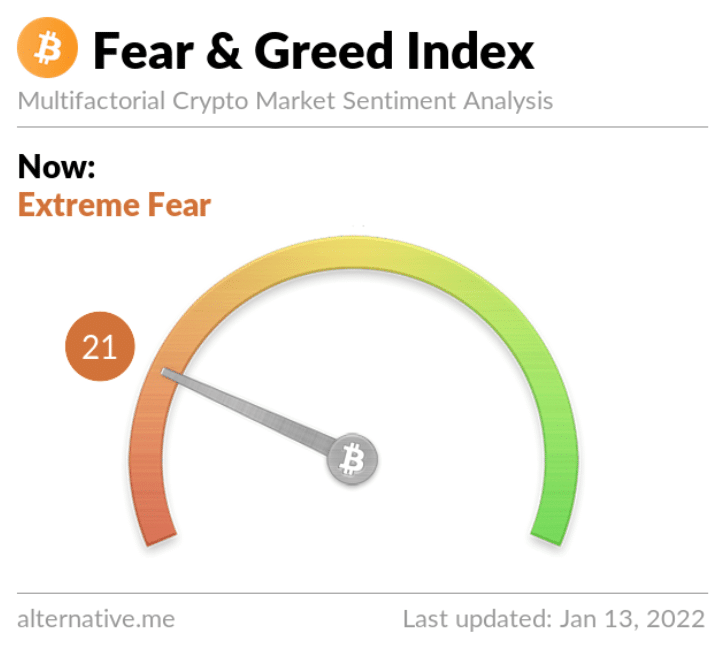
The Fear and Greed Index is 21 Extreme Fear and -1 from yesterday’s reading of 22 Extreme Fear.
Bitcoin’s Moving Averages: 20-Day [$46,521.30], 50-Day [$52,777.28], 100-Day [52,435.38], 200-Day [$47,677.67], Year to Date: [$43,643.90].
BTC’s 24 hour price range is $42,543-$44,288 and its 7 day price range is $40,655-$44,288. Bitcoin’s 52 week price range is $28,991-$69,044.
The price of bitcoin on this date last year was $37,456.
The average price of BTC for the last 30 days is $46,508.
Bitcoin’s price [+2.73%] closed its daily candle worth $43,909 and in green figures for the fourth time in five days.
Summary
Ethereum Analysis
Ether’s price also proved with further confirmation on Wednesday that bulls again have momentum and ETH’s price finished +$132.55.
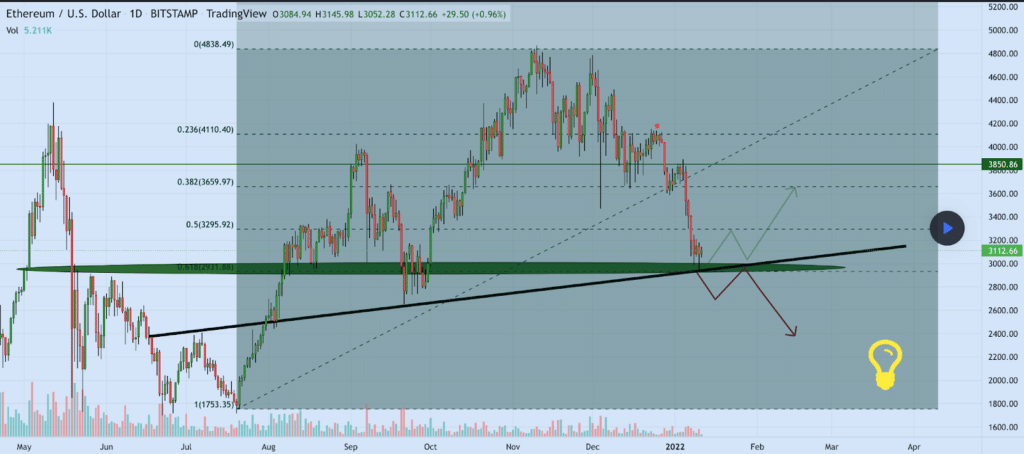
Today we’re examining the ETH/USD 1D chart below from MadWhale and the most critical levels in the interim for Ether market participants.
Ether bulls again reclaimed the 0.5 fib level [$3,295.92] and now are seeking to flip the 0.38 fib level [$3,659.97] from overhead resistance to support again as well.
For bearish ETH traders they’re seeking a quick stop to the momentum that Ether bulls have mustered over the last few days. To stop that momentum ETH bears need to again crack the 0.5 fib level and send ETH’s price back down to test the 0.618 fib level [$2,931.88] once again. Candle close confirmation below the 0.618 would prove the strength of bears over the short term.
Ether’s Moving Averages: 20-Day [$3,725.16], 50-Day [$4,099.10], 100-Day [$3,840.31], 200-Day [$3,223.08], Year to Date: [$3,426.21].
ETH’s 24 hour price range is $3,220-$3,410 and its 7 day price range is $3,011-$3,555. Ether’s 52 week price range is $1,010-$4,878.
The price of ETH on this date in 2020 was $1,132.
The average price of ETH for the last 30 days is $3,720.
Ether’s price [+4.09%] closed its daily candle worth 3,370.48 and in green digits for a second straight day on Wednesday.
Fantom Analysis
Fantom’s price is continuing to climb as bullish FTM traders again sent it higher on Wednesday with a candle close +$0.35 higher than Tuesday’s daily session.
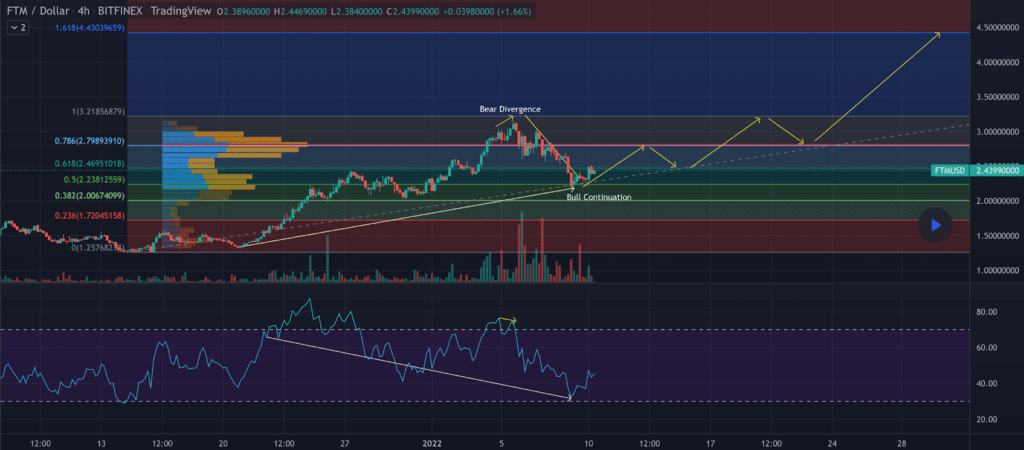
The FTM/USD 4HR chart below from Crypto-Phoenix-168 illuminates the most desirable levels for FTM traders over the coming days. Fantom bulls have broken the 0.786 fib level [$2.79] and flipped that level from resistance to support. Their secondary target is now 1 [$3.21].
From the bearish FTM traders perspective, they again need to send FTM’s price below the 0.786 and back down to the 0.618 fib [$2.46]. If they’re successful at those levels then a third target for FTM bears is at the 0.5 fib [$2.23].
The second FTM chart we’ll look at today is the FTM/USD 1D from MKBillions. As traders will note, FTM’s price bullishly engulfed on Tuesday after a re-test of the neckline of its inverse Head and Shoulders pattern.
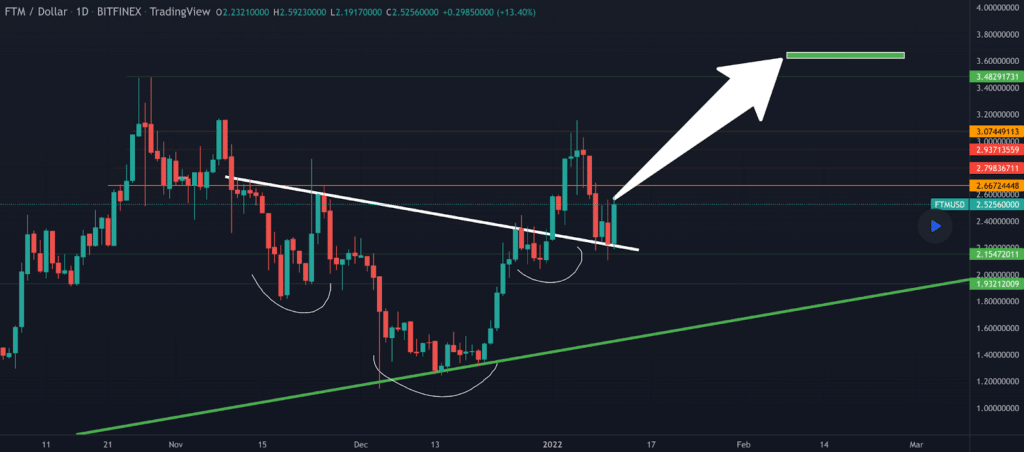
Fantom’s price is +117.3% for the last 30 days against The U.S. Dollar, +138.3% against BTC, and +153.4% against ETH over the same duration.
Fantom’s 24 hour price range is $2.60-$3.01 and its 7 day price range is $2.20-$3.02. FTM’s 52 week price range is $.02-$3.46.
Fantom’s price on this date last year was $.02.
The average price for FTM over the last 30 days is $2.12.
Fantom’s price [+13.55%] closed its daily session on Wednesday worth $2.94 and in green figures for the third time over the last four days.


