




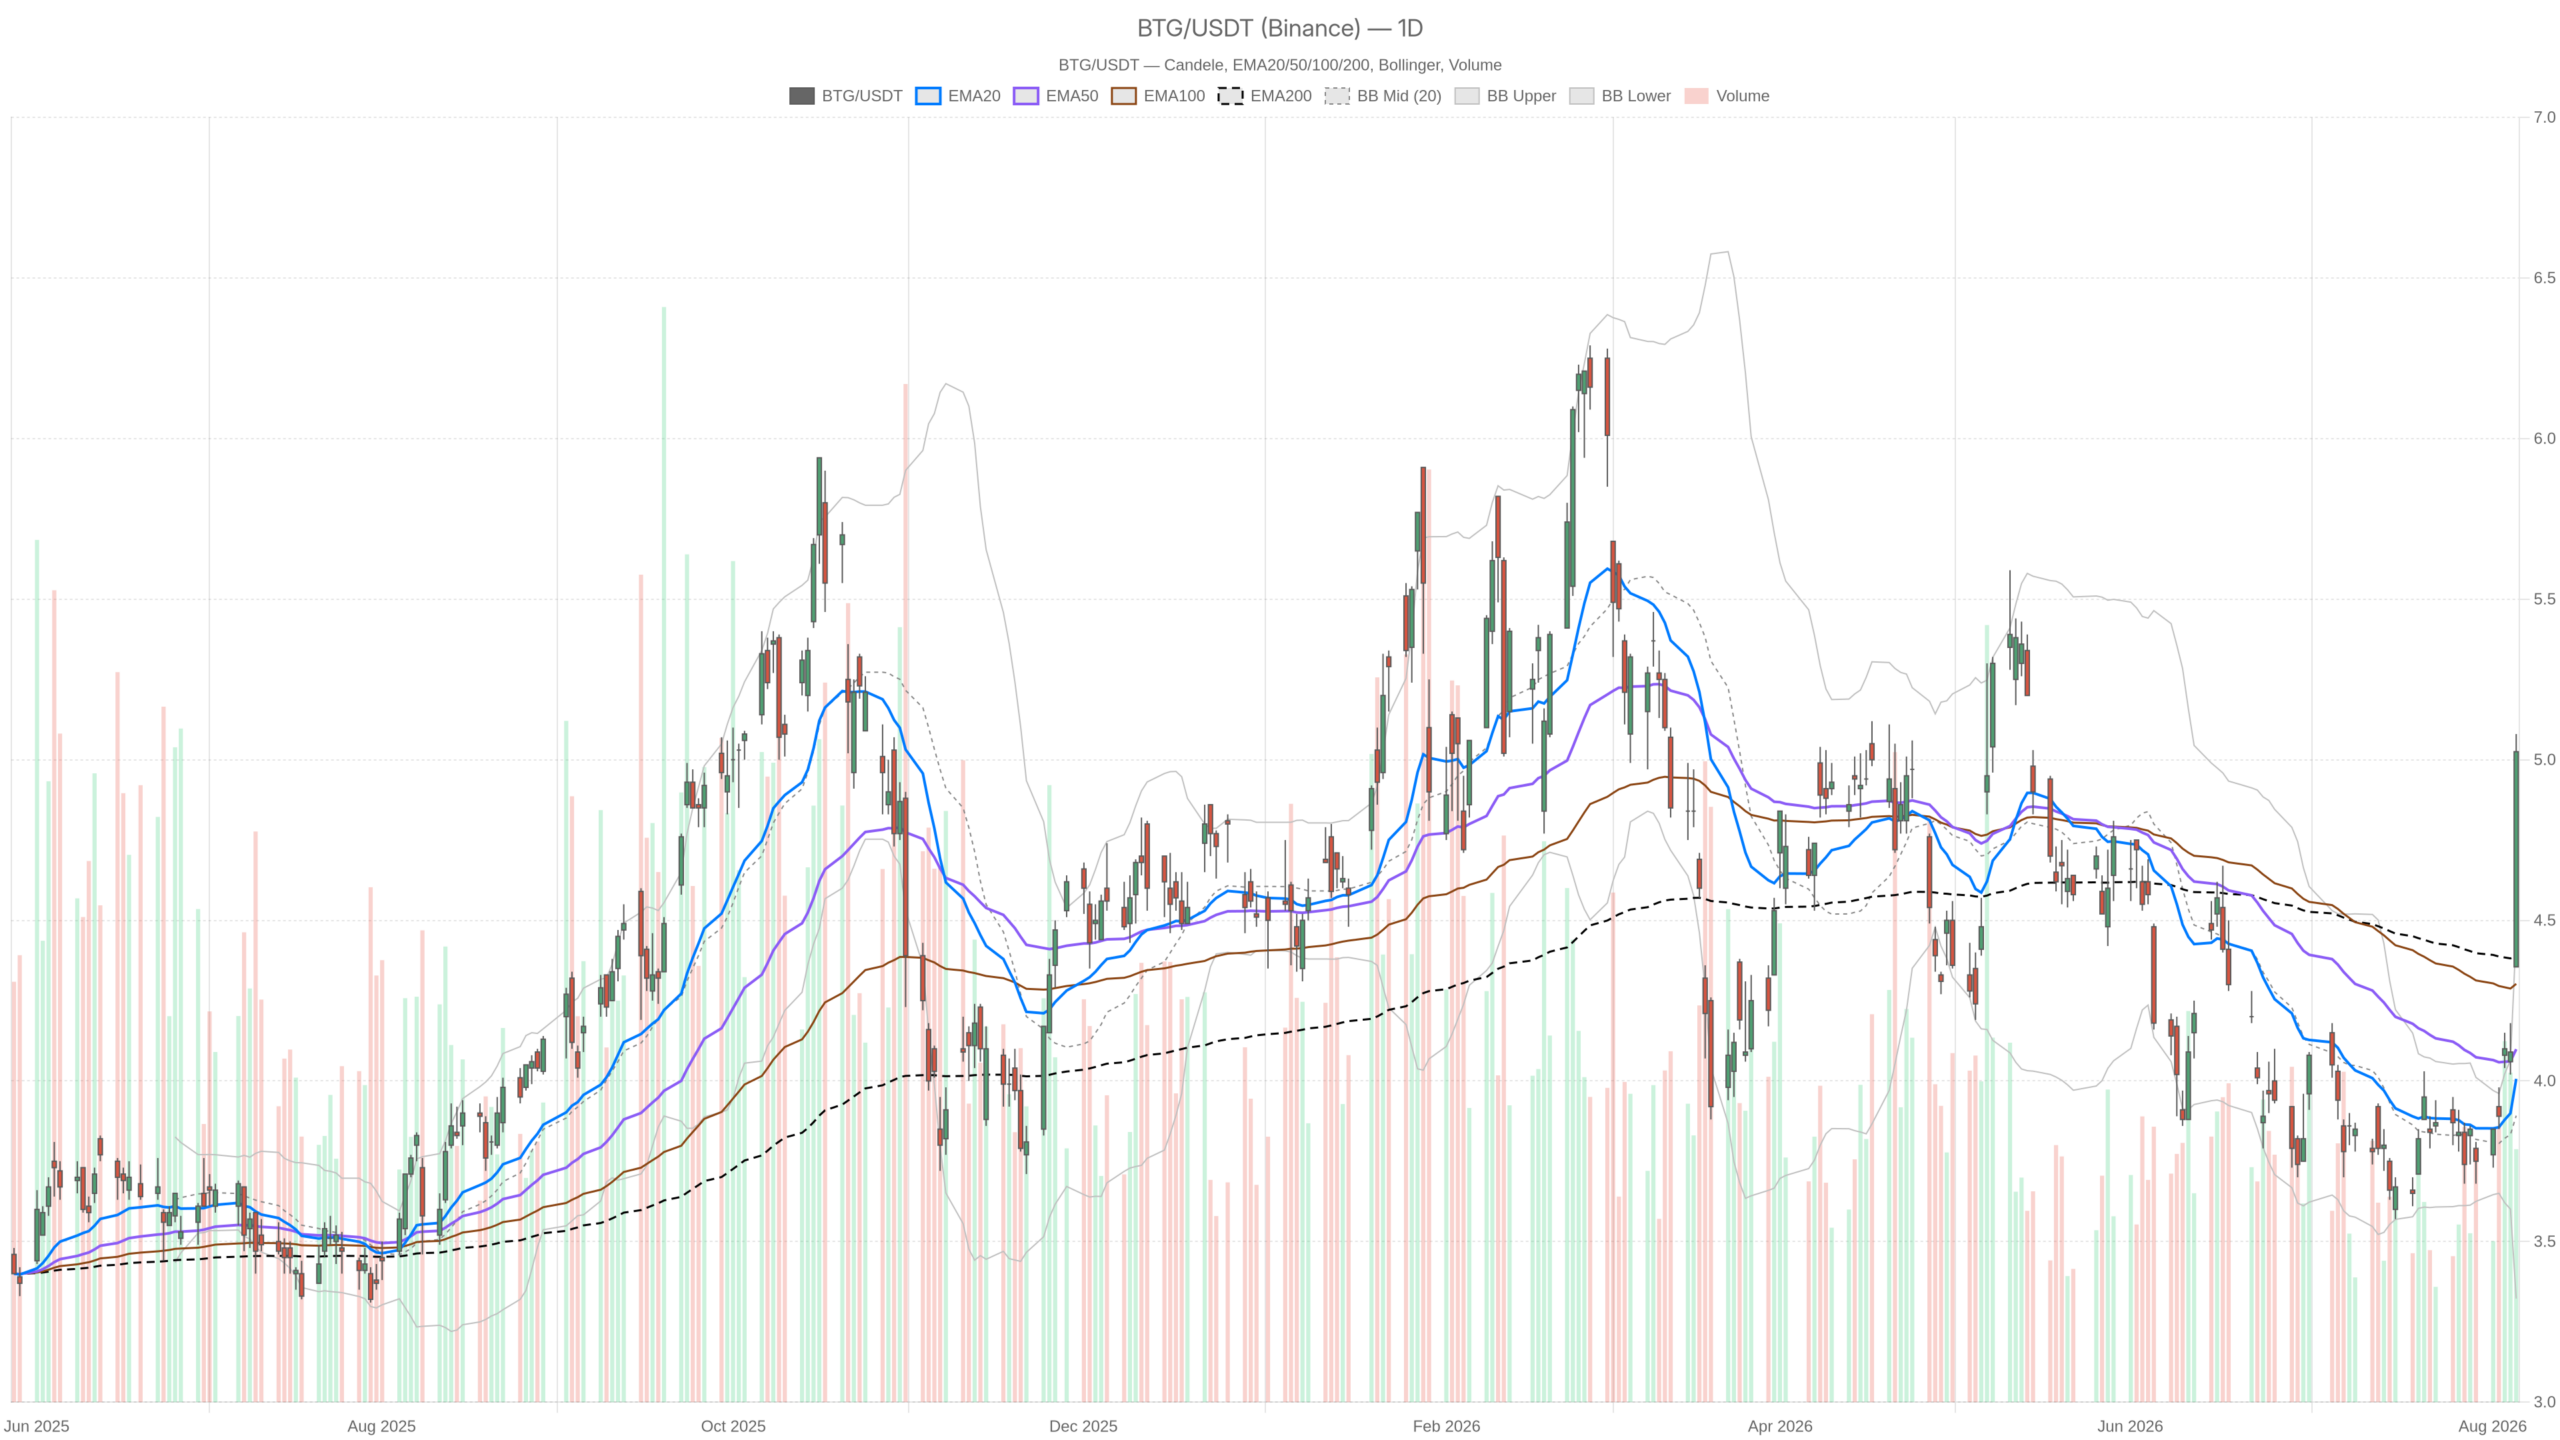
B2Gold Corp stock reset its chart on Friday. BTG surged from $4.36 to close at $5.03 on 23.6 million shares. Mali approved the Menankoto exploitation permit—removing a permitting overhang, not trading a rumour.
Summary
Key takeaways
- B2Gold Corp stock surged from $4.36 to close at $5.03 on volume of 23.6 million shares after Mali granted the Menankoto exploitation permit.
- The daily session travelled $0.72—more than three times the daily ATR of $0.22—closing far above the upper Bollinger Band at $4.46.
- Daily RSI hit 76.63 and hourly RSI reached 83.32, signalling strength first but compressing near-term reward for immediate continuation.
- Bullish structure is confirmed across daily and hourly charts, but the extension argues for consolidation or partial retracement before the next leg.
- The honest tactical read: trend says up, extension says wait—position sizing matters more than direction here.
Daily structure: one candle rewrote the B2Gold Corp stock trend
Friday’s session flipped the daily bias decisively bullish for B2Gold Corp stock. A single catalyst-driven candle propelled BTG above every major moving average after a prolonged period of trading below them.
Moving averages and trend context
Before Friday, BTG was trading below all of its major daily averages. Now price sits at $5.03 against an EMA20 of $4.01, an EMA50 of $4.10 and an EMA200 of $4.39. The moving average stack itself remains bearishly ordered, with the 200-day above the 50-day and the 20-day. That reveals how heavy the prior structure was—and how violently the news repriced it.
Notably, the daily regime is still classified as neutral. That is a lagging read, not a contradiction. Trend filters need follow-through before they confirm what price already did.
Momentum confirms, but volatility warns
Meanwhile, momentum agrees with the breakout. The daily MACD line has crossed above its signal, at 0.08 versus -0.04, with a histogram of 0.11. That is a fresh cross off depressed levels—usually the more durable kind. Daily RSI at 76.63 is firmly overbought. In strong repricing events, that reads as strength first and exhaustion later.
However, volatility is the real warning. Daily ATR sits at just $0.22, yet the session travelled $0.72 from low to high. Price also closed far above the upper Bollinger Band at $4.46, with the mid at $3.89. Moves stretched this far outside statistical range rarely continue in a straight line. Consolidation or a partial retracement is the base case—not a reversal.
Pivot levels frame the arithmetic
Overall, daily pivots frame the arithmetic. The pivot point is $4.82, R1 sits at $5.29 and S1 at $4.56. Price closed above the pivot and below R1, leaving the breakout intact but unfinished.
The 1H chart confirms the B2Gold Corp stock breakout—and flags the stretch
The hourly chart reinforces the bullish structure on B2Gold Corp stock while simultaneously signalling that the move is extended. Buyers are holding the highs, but the stretch is visible across every timeframe indicator.
Here, the regime is bullish and the averages are properly aligned: EMA20 at $4.51, EMA50 at $4.19, EMA200 at $3.98. Price above a rising stack is textbook trend continuation. On this timeframe, it is genuine rather than cosmetic.
Hourly MACD confirms this, at 0.30 against a 0.21 signal with a 0.08 histogram. Momentum is still expanding, though the rate of expansion has begun to flatten. Meanwhile, hourly RSI at 83.32 is the most stretched reading across all three timeframes. Overbought on a trending intraday chart is not a sell signal. However, it compresses the reward left in immediate continuation.
The most informative detail is the hourly pivot cluster. PP at $5.01, R1 at $5.05 and S1 at $4.98 describe an extremely narrow band. The final hour closed at $5.03 with a range of just seven cents. Hourly ATR of $0.14 against that range shows volatility contracting into the close. Buyers are holding the highs rather than distributing into them. The hourly upper Bollinger Band at $5.26 leaves room above. The mid at $4.40 marks where a real unwind would begin.
15-minute execution context for BTG
The 15-minute chart shows B2Gold Corp stock’s short-term momentum beginning to cool after Friday’s surge. Fading thrust on this timeframe does not signal reversal. It flags the compression that defined the final hour of trade.
On this shorter timeframe, short-term momentum is the first thing to cool. RSI has eased to 69.53. The MACD histogram has turned slightly negative at -0.03, with the line at 0.15 below its 0.18 signal. That is fading thrust, not reversal.
Underneath, structure remains constructive. EMA20 at $4.91, EMA50 at $4.62 and EMA200 at $4.15 are stacked in order. Price closed above all three. Bollinger Bands sit tight between $4.84 and $5.15 around a $4.99 mid. ATR of $0.05 confirms how compressed the tape became into the bell.
Bullish scenario for B2Gold Corp stock
The bullish case for B2Gold Corp stock requires acceptance above the hourly pivot cluster near $5.05. From there, daily R1 at $5.29 becomes the logical near-term target, sitting just above the hourly upper band at $5.26.
In this scenario, sustained trade above $5.01 would keep the breakout structurally healthy, provided the 15-minute mid at $4.99 holds as support. A second session of expanded volume would matter more than another spike in RSI.
Bearish scenario for B2Gold Corp stock
In contrast, the bearish case on B2Gold Corp stock centres on the mean-reversion risk inherent in gap-driven moves. A loss of $4.98 on the hourly would signal trouble. A break of the 15-minute lower band at $4.84 would confirm late buyers are being flushed.
Below that, daily S1 at $4.56 is the first meaningful shelf. It sits close to the EMA200 at $4.39. A retreat toward the hourly mid at $4.40 would neutralise the daily breakout entirely. Any close back beneath the daily pivot of $4.82 weakens the bullish case immediately.
Positioning and uncertainty on BTG
Overall, B2Gold Corp stock is trending higher on a genuine fundamental trigger, with daily and hourly charts aligned. The conflict is not directional—it is temporal. Trend says up. Extension says wait.
Notably, price sits roughly $0.57 above the upper daily band. The realised range was more than three times daily ATR. In this context, position sizing carries more weight than direction. Gaps of this nature either consolidate and extend, or they retrace toward the pivot and rebuild. Until BTG proves which, the honest read is bullish structure with elevated near-term uncertainty.
FAQ
What drove B2Gold Corp stock higher on Friday?
Mali’s government granted the Menankoto exploitation permit, which together with the Dandoko exploration permit forms Fekola Regional. This removed a significant permitting overhang—not a rumour, but a concrete catalyst.
Is B2Gold Corp stock overbought after the breakout?
Yes, across multiple timeframes. Daily RSI sits at 76.63 and hourly RSI reached 83.32. In strong repricing events, overbought readings signal strength first and exhaustion later—but they do compress near-term reward for immediate continuation.
What are the key levels to watch on BTG?
On the upside, acceptance above $5.05 opens the path to daily R1 at $5.29. On the downside, a loss of $4.98 and the 15-minute lower band at $4.84 would signal trouble. Daily S1 at $4.56 is the first meaningful shelf below.
Should traders chase the B2Gold Corp stock breakout?
The structure is bullish, but the extension argues for caution. With the session travelling more than three times daily ATR, consolidation or a partial retracement is the base case. Position sizing carries more weight than direction at current levels.
Disclaimer: This article is for informational purposes only and does not constitute financial advice, an investment recommendation, or a solicitation to buy or sell any financial instrument or cryptocurrency. The analysis provided is not indicative of future results. Investing in crypto assets and financial markets carries a high risk of capital loss. Always do your own research (DYOR) and consult a qualified financial advisor before making any decision.
Article produced with the assistance of artificial intelligence and reviewed by the editorial team.
