



nLIGHT, Inc. stock closed at $56.67 on 7 August after a session that started with promise and ended with damage. The company beat Q2 2026 earnings and revenue estimates, driven by record aerospace and defense demand. When good news is met with distribution, the market signals positioning concerns, not fundamentals.
Summary
Key takeaways
- nLIGHT, Inc. stock fell to $56.67 on 7 August despite beating Q2 2026 earnings and revenue estimates.
- The stock closed below the 200-day EMA at $57.24, the pivotal technical level for the entire setup.
- Daily ATR of $7.23 represents roughly a 12–13% average daily range, raising risk for both sides.
- Hourly RSI at 22.94 is deeply oversold, while daily RSI at 39.54 still has room to fall.
- A reclaim of the $57.24–$58.26 resistance zone is required to treat the sell-off as a shakeout.
Daily Structure: A Trend That Has Already Broken
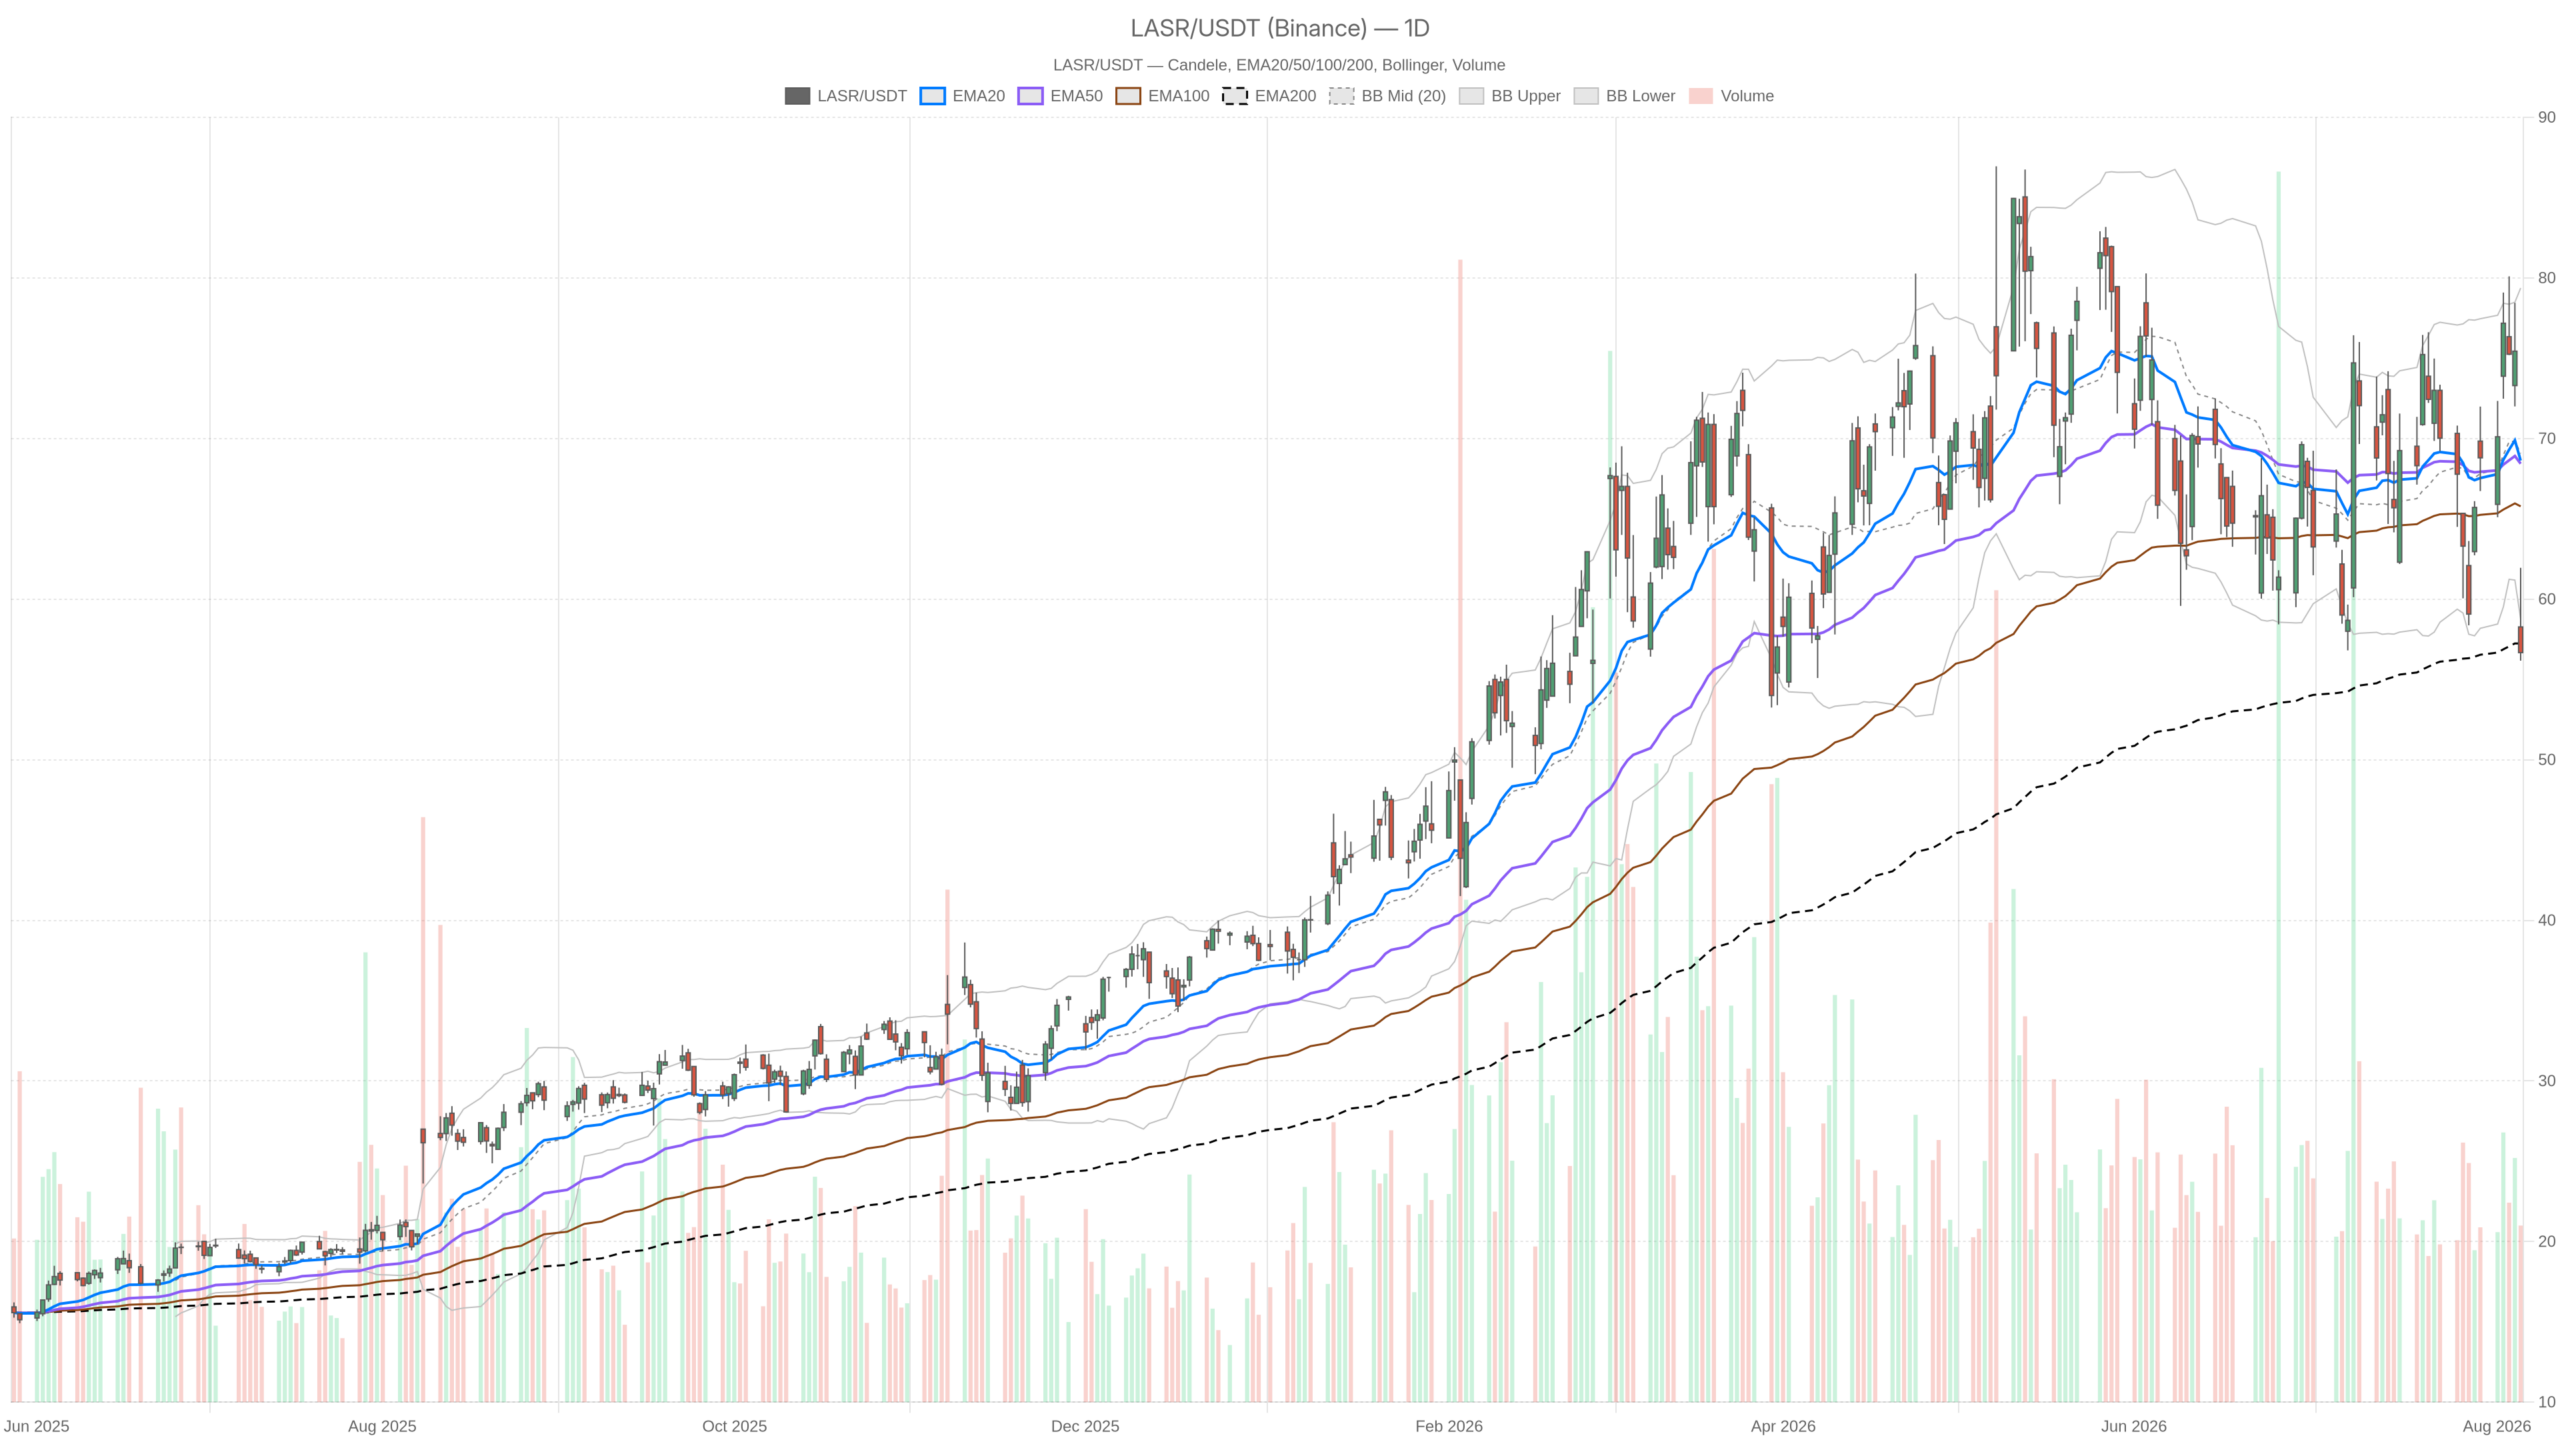
The daily trend for nLIGHT, Inc. stock has already broken down. Price is trading below the 20-day EMA at $68.63 and the 50-day EMA at $68.43, both now clustered well above spot as overhead supply. Friday’s close slipped beneath the 200-day EMA at $57.24, which is now the pivot for everything that follows.
Momentum Signals Confirm the Breakdown
The daily MACD line at 0.14 has crossed below its signal at 0.40, leaving a histogram of -0.26. Momentum has flipped from expansion to contraction from a level barely above zero. That is not a deep bearish extreme, but it removes the last piece of trend support bulls had.
Meanwhile, RSI at 39.54 tells a similar story without panic. It is weak and below the midline, yet nowhere near washed out on the daily timeframe. In other words, there is room lower before the daily chart becomes technically stretched.
Volatility and Pivot Levels Frame the Risk
More telling is the Bollinger picture. The daily midline sits at $69.07 with the lower band at $58.76. Price closed beneath that lower band. Closes outside the band usually mark either capitulation or the start of a genuine volatility expansion. Given the earnings catalyst, the second interpretation deserves respect.
Volatility is the number that should reframe everyone’s risk assumptions. Daily ATR stands at $7.23. Against a $56.67 close, that is roughly a 12–13% average daily range. Therefore any level-based thinking must be measured in dollars, not cents. The system labels the daily regime as neutral, and that fits: the trend is broken, but a directional trend lower has not yet been confirmed.
In this context, daily pivots frame the immediate battleground. The pivot point is $58.26, with R1 at $60.36 and S1 at $54.58. Notably, the pivot sits just above the 200-day EMA, stacking resistance in the $57.24–$58.26 zone.
The 1H Chart Complicates the Bearish Read
The hourly chart is oversold yet still accelerating lower. That combination makes chasing the downside risky despite the clearly bearish structure on this timeframe.
Oversold and Still Accelerating
Hourly momentum is severely stretched. RSI on the 1H is 22.94, deep in oversold territory. At the same time, the hourly MACD line at -4.41 sits below its signal at -2.18, with a histogram of -2.23. That combination describes an aggressive, still-accelerating downside impulse.
Structurally, the hourly chart is unambiguous. Price trades below the 20-period EMA at $66.82, the 50-period at $69.31 and the 200-period at $68.57. All three are bunched between $66 and $70, far above the market. That is a heavy resistance shelf and it will take real buying to reclaim.
Wide Bands, Poor Risk Symmetry
However, the hourly Bollinger bands warn against chasing. The mid sits at $70.34 with the lower band at $52.35, an extraordinary spread. Hourly ATR of $3.30 confirms the volatility shock. Bands that wide typically precede violent two-way movement, not clean trends. Therefore short-term continuation trades carry unusually poor risk symmetry here.
Hourly pivots are compressed: pivot $56.92, R1 $57.30, S1 $56.29. That tightness reflects a market that stopped falling into the close rather than one that reversed.
15m: The First Flicker of Stabilisation
The 15-minute chart offers the first hint that selling pressure is decelerating, though it is not yet a reversal signal. The regime is explicitly bearish, with price at $56.57 sitting below the 20-period EMA at $59.11, the 50-period at $64.59 and the 200-period at $69.49. Nothing about that ladder is constructive.
On the other hand, the short-term MACD has begun to turn. The line at -2.68 is above its signal at -3.24, producing a positive histogram of 0.55. RSI at 24.98 remains oversold but is no longer collapsing. ATR has compressed to $0.81 and the Bollinger range has narrowed to $55.71–$60.31, with the mid at $58.01. Selling pressure is decelerating, which is a timing observation, not a trend signal.
Bullish Scenario for nLIGHT, Inc. Stock
The bull case for nLIGHT, Inc. stock rests on the fundamental headline eventually winning. Q2 beat expectations on both earnings and revenue, with record aerospace and defense demand supporting product sales and margins. If the sell-off was forced positioning rather than a change in outlook, the recovery signature is straightforward.
To succeed, bulls need a reclaim of the 200-day EMA at $57.24 and then the daily pivot at $58.26. Above that, the 15-minute Bollinger mid at $58.01 and the upper band near $60.31 line up with daily R1 at $60.36. A push back through $60.36 would mark the day’s damage as a shakeout. However, the deeper repair job only begins near the $66–$69 EMA cluster.
Bearish Scenario and What Invalidates the Bounce
In contrast, the bearish path is the path of least resistance while price holds below $57.24. Acceptance under the daily lower Bollinger band at $58.76 keeps the volatility expansion pointed downward. Losing daily S1 at $54.58 would confirm that Friday’s close was continuation rather than exhaustion.
Below that, the hourly lower band at $52.35 becomes the reference for how far a stretched market can travel. Any bullish attempt is invalidated by a failed retest of $57.24–$58.26 followed by a lower low beneath $56.17.
Positioning Into the Uncertainty
Overall, the signals are genuinely mixed, and pretending otherwise would be careless. The daily trend has broken while the daily regime remains neutral. The hourly chart is oversold yet still accelerating lower, and the 15-minute chart shows only decelerating pressure, not reversal.
With a $7.23 daily ATR and an earnings beat that the market chose to sell, nLIGHT, Inc. stock is a high-variance situation where position size matters more than direction. The $57.24 line separates a violent shakeout from a deeper repricing. Until it is reclaimed and held, the burden of proof sits with the buyers.
FAQ
What happened to nLIGHT stock after its Q2 2026 earnings report?
nLIGHT, Inc. stock closed at $56.67 on 7 August, down sharply despite beating Q2 2026 earnings and revenue estimates. The stock printed a session high of $61.95 and a low of $56.17, finishing near the bottom of its range as the market distributed into good news.
What is the most important technical level for LASR right now?
The 200-day EMA at $57.24 is the pivotal level. Friday’s close slipped below it, and until price reclaims and holds above this level, the burden of proof remains with buyers. The $57.24–$58.26 zone stacks additional resistance from the daily pivot point.
Is nLIGHT stock a buy after the post-earnings sell-off?
The technical picture is mixed. The daily trend has broken and momentum has flipped negative, but the hourly chart is deeply oversold with RSI at 22.94. The 15-minute chart shows decelerating selling pressure, but no confirmed reversal. Position sizing matters more than direction in this high-variance environment.
What is the bearish scenario for nLIGHT, Inc. stock?
If price holds below $57.24, the bearish path remains the path of least resistance. A break below daily S1 at $54.58 would confirm continuation. The next reference lower is the hourly Bollinger lower band at $52.35. Any bounce that fails at $57.24–$58.26 and then makes a lower low beneath $56.17 invalidates the bullish case.
Disclaimer: This article is for informational purposes only and does not constitute financial advice, an investment recommendation, or a solicitation to buy or sell any financial instrument or cryptocurrency. The analysis provided is not indicative of future results. Investing in crypto assets and financial markets carries a high risk of capital loss. Always do your own research (DYOR) and consult a qualified financial advisor before making any decision.
Article produced with the assistance of artificial intelligence and reviewed by the editorial team.
