Summary
Bitcoin Analysis
Bitcoin’s price broke up two consecutive days of green price action on Wednesday. The world’s most prominent digital asset concluded its daily session by finishing marginally in red figures and -$150.4.
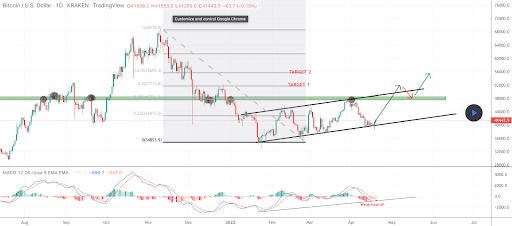
The first chart we’re analyzing today is the BTC/USD 1D chart below from papoutridou. BTC’s price is trading between the 0 fibonacci level [$34,853.5] and 0.236 [$42,812.5], at the time of writing.
Bullish traders are taking aim overhead at the 0.236 fib level followed by 0.382 [$47,736.2], and 0.5 [$51,715.8].
From the perspective of bearish BTC traders, they’re seeking a full retracement to the $34,8k level in hopes of being able to again test the yearly low at the $29,3k level.
Bearish traders still appear to be in control of BTC’s price action with the price of bitcoin still trading near the bottom of BTC’s current ascending channel.


Bitcoin’s Moving Averages: 5-Day [$40,758.26], 20-Day [$43,497.51], 50-Day [$41,854.48], 100-Day [$43,236.33], 200-Day [$46,794.20], Year to Date [$41,541.87].
BTC’s 24 hour price range is $40,958-$42,152 and its 7 day price range is $38,779-$42,152. Bitcoin’s 52 week price range is $29,341-$69,044.
The price of bitcoin on this date last year was $56,294.
The average price of BTC for the last 30 days is $43,261.
Bitcoin’s price [-0.36%] closed its daily candle worth $41,366.4 on Wednesday.
Ethereum Analysis
Ether’s price also finished up its daily candle down less than 1% and -$25.53.
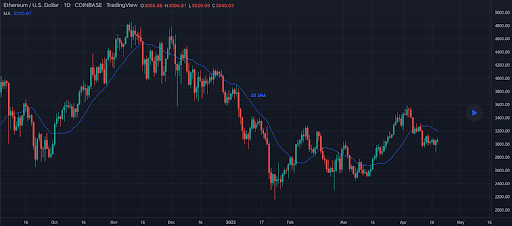
The ETH/USD 1D chart below by Tradersweekly shows Ether’s price is in a consolidation pattern with the $3k level providing support over the last 30 days.
Overhead resistance exists on Ether for bullish market participants at the $3,6k level. Conversely, bearish traders have to break the support of bullish Ether traders at the $2,6k level before more long-term damage may ensue.

Ether’s Moving Averages: 5-Day [$3,049.21], 20-Day [$3,210.53], 50-Day [$2,958.17], 100-Day [$3,212.48], 200-Day [$3,344.09], Year to Date [$2,980.82].
ETH’s 24 hour price range is $3,046-$3,160 and its 7 day price range is $2,898-$3,160. Ether’s 52 week price range is $1,719-$4,878.
The price of ETH on this date in 2021 was $2,324.
The average price of ETH for the last 30 days is $3,179.
Ether’s price [-0.82%] closed its daily candle on Wednesday worth $3,076.44 and in red figures for the first time this week.
Sand Analysis
SAND’s price posted the worst performance of the three assets covered today and sold-off more than 2% [-$0.05] during its daily session on Wednesday.
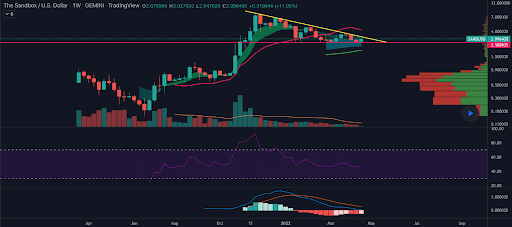
The SAND/USD 1W chart below from rfc4 shows SAND’s price holding the $2.99 level as support on the weekly time frame.
If bullish SAND market participants can exceed the current demand line on the weekly timescale then bullish traders may be able to anticipate a nice move to the upside.
From the perspective of bearish Sandbox traders, if they’re successful in cracking the $2.99 level and get a weekly candle close below that level we may see further bearish continuation to the downside of the chart.

SAND’s trading volume has more than tripled over the last 4 days. On April 17th SAND’s trading volume was $225m and Wednesday it was $784m.
Has SAND’s recent price action been driven by bullish news or merely the technicals?
According to Bloomberg SoftBank-Backed Sandbox is seeking funding equivalent to $4b. There were also a number of new developments announced during the Paris Blockchain Summit event, reported on by Amelia Tomasicchio of The Cryptonomist on April 16th.
The Sandbox is +512.8% against The U.S. Dollar for the last 12 months, +718.2% against BTC, and +328.7% against ETH over the same duration, at the time of writing.
SAND’s 24 hour price range is $2.83-$3.08 and its 7 day price range is $2.58-$3.08. The 52 week price range of The Sandbox is $0.72-$8.40.
The Sandbox price on this date last year was $0.52.
The average price of SAND over the last 30 days is $3.13.
The Sandbox price [-2.07%] closed its daily session worth $2.86 on Wednesday. SAND’s price is -6.7% for the last month, at the time of writing.


