Summary
Bitcoin Analysis
Bitcoin’s price traded back in red figures by nearly 4% on Monday and concluded its daily session -$1,192.
With the short-term and mid-term sentiment mixed amongst market participants, Bitfinext Market Analysts recently chimed in on the state of the crypto market short-term to long-term and the role of institutional capital on the digital token economy:
“The recent market volatility that we’ve witnessed is drawing increasing numbers of institutional investors into the space, especially those with an interest in derivatives. This belies the outflow that is being seen in digital token investment products indicating that interest — in bitcoin in particular — remains high. Investment from big institutions in infrastructure supporting the digital token economy continues, as evidenced by the recent investments made by Goldman Sachs and Barclays in Elwood Technologies. The icy calculation of institutional capital pours scorn on bitcoin’s critics. Today, prices across the cryptocurrency space are in the green. Regardless, this is a long-term game.”
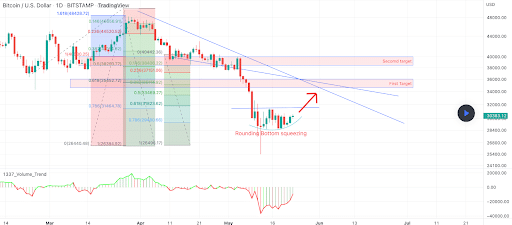
The first chart we’re analyzing today is the BTC/USD 1D chart. That chart from MJShahsavar shows the important levels for traders of this market. BTC’s price is trading between the 1 fibonacci level [$26,496.17] and 0.786 [$29,480.66], at the time of writing.
Bullish traders really need to get back above the 0.236 for market participants to potentially flip bullish again. The barriers along the way to test that level are 0.786, 0.618 [$31,823.62], 0.5 [$33,469.27], 0.382 [$35,114.92] and then 0.236 [$37,151.06].
Conversely, bearish traders are trying to hold BTC’s price below the 0.786 fib and finally break $29k with a candle close on the weekly time frame. Below $29k is 1 [$26,496.17] which is the 12 month low per this chart.


Bitcoin’s Moving Averages: 5-Day [$29,791.10], 20-Day [$33,581.08], 50-Day [$39,023.88], 100-Day [$39,861.59], 200-Day [$46,289.61], Year to Date [$39,922.61].
BTC’s 24 hour price range is $28,863-$30,666 and its 7 day price range is $28,772-$30,684. Bitcoin’s 52 week price range is $26,600-$69,044.
The price of Bitcoin on this date last year was $38,772.9.
The average price of BTC for the last 30 days is $34,136.7 and BTC’s -23.5% over the same duration.
Bitcoin’s price [-3.94%] closed its daily candle worth $29,091 and in red figures for the first time over the last three days on Monday.
Ethereum Analysis
Ether’s price added further confirmation that the $1,700-$1,800 level could be tested soon with its seventh consecutive weekly red candle close on Sunday. ETH’s price also traded lower at the day’s close than at the open and ETH finished -$70.3 on Monday.
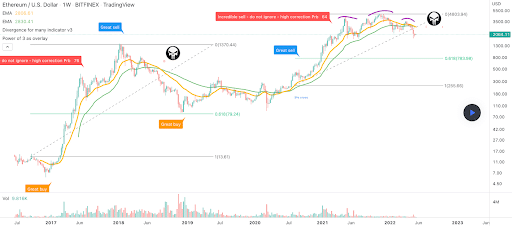
The ETH/USD 1W chart below without_worries shows Ether’s price trading between the 0.618 fib level [$783.98] and 0 [$4,803.94], at the time of writing.
The chartist posits that the most probable bottom on Ether based on his interpretation of the weekly timescale is the $800 level or 0.618 fibonacci level. The 0.618 fib level is what’s commonly referred to as The Golden Pocket, this is the most respected Fibonacci Retracement level.

ETH’s 24 hour price range is $1,957.12-$2,088.5 and its 7 day price range is $1,915.18-$2,110.55. Ether’s 52 week price range is $1,719-$4,878.
The price of ETH on this date in 2021 was $2,648.50.
The average price of ETH for the last 30 days is $2,449.83 and ETH’s -23.5% over the same timespan.
Ether’s price [-3.44%] closed its daily candle on Monday worth 1,972.98. ETH’s price also finished back in red digits after posting two consecutive green candles over the weekend.
Fantom Analysis
Fantom’s price traded less than 1% down on Monday and bearish traders snapped a streak of four consecutive green candles for FTM. FTM’s price closed Monday’s trading session -$0.002.
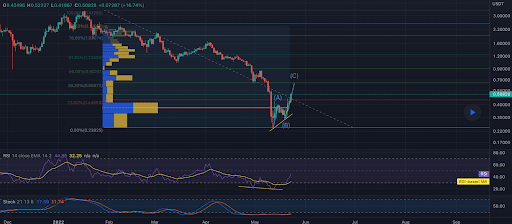
The FTM/USDT 1D chart below from aminkz2020 illuminates how critical of a level FTM’s price is testing. FTM’s price closed just below the 23.60% fib level [$0.446] on Monday.
The overhead targets for bullish FTM market participants if they can reclaim the 23.60% fib level are 38.20% [$0.658], 50.00% [$0.90], and 61.80% [$1.23].
The downside target for bears if they can hold off bulls at the 23.60% fib level is 0.00% [$0.238]. If bearish traders can send FTM’s price back down to $0.23 for a full retracement, that would be another 46.3% decrease of FTM’s price forthcoming.

Fantom’s 24 hour price range is $0.418-$0.522 and its 7 day price range is $0.307-$0.522. FTM’s 52 week price range is $0.153-$3.46.
Fantom’s price on this date last year was $0.342.
The average price of FTM over the last 30 days is $0.629 and FTM’s -55.8% over the same timespan.
Fantom’s price [-0.44%] closed its daily session on Monday worth $0.433.


