

Summary
Bitcoin Analysis
Bitcoin’s bulls outbidded bearish traders on Sunday to paint a green daily candle [+$844] yet bears still won the weekly candle and painted a red candle for the 8th consecutive week. That was the first time in the 13+ year history of bitcoin that BTC closed the weekly time frame with eight straight weeks of negative price action.
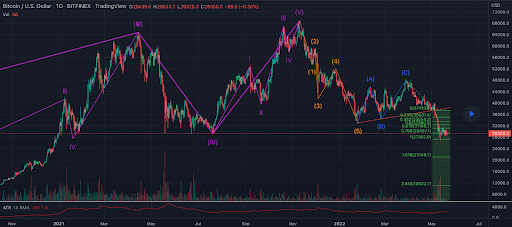
The first chart we’re analyzing today is the BTC/USD 1D chart below by sngyuchao. BTC’s price is trading between 0.786 [$29,467.1] and 0.618 [$31,166.7], at the time of writing.
The first target that BTC traders need to regain to turn around the current bearish trend is the 0.5 fibonacci level [$32,360.5]. The secondary target overhead is 0.382 [$33,554.3] followed by a third target of 0.236 [$35,031.4].
What do bears need to do to continue the larger BTC and macro cryptocurrency downtrend?
Bearish traders need to push BTC’s price below the 0.786 fib level with a second target of 1 [$27,302.0]. The third target below for bearish traders is 1.618 [$21,049.7].
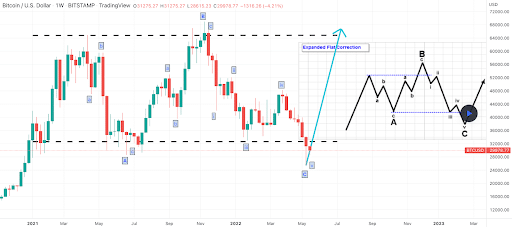
The second BTC chart we’re looking at today is the BTC/USD 1W chart from Hekmachine. This chart was charted before yesterday’s weekly close. The chartist posits that BTC’s price is in an expanded flat correction pattern. If the chartist is correct, BTC’s price has already found its new low price.
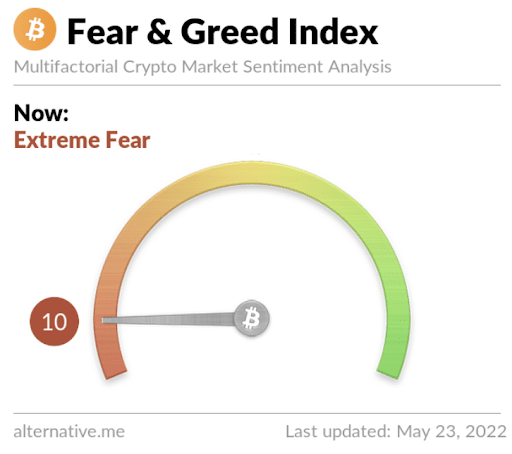
The Fear and Greed Index is 10 Extreme Fear and is -4 from yesterday’s reading of 14 Extreme Fear.
Bitcoin’s Moving Averages: 5-Day [$29,703.98], 20-Day [$34,071.35], 50-Day [$39,191.36], 100-Day [$40,018.34], 200-Day [$46,368.23], Year to Date [$40,018.34].
BTC’s 24 hour price range is $29,348-$30,451 and its 7 day price range is $28,772-$31,319. Bitcoin’s 52 week price range is $ $26,600-$69,044.
The price of bitcoin on this date last year was $34,730.3.
The average price of BTC for the last 30 days is $34,428.7 and BTC’s -25.9% over the same time frame.
Bitcoin’s price [+2.87%] closed its daily candle worth $30,283 and in green figures for a second straight day on Sunday.
Ethereum Analysis
Ethereum Founder, Vitalik Butterin, announced last week the merge event from PoW [Proof-of-Work] to PoS [Proof-of Stake] could take place as early as August of this year.
So, what will that mean for the price of Ether over the coming weeks and months as we tread deeper into 2022? Will that event be enough to reverse Ether’s price to the upside of the charts if the macro cryptocurrency market’s downtrend is still intact? Will the Merge actually take place in August?
Ether’s price also closed the weekly time frame in red figures and has finished seven consecutive weeks in red digits. ETH’s price finished up over 3% on Sunday and +$68.12.
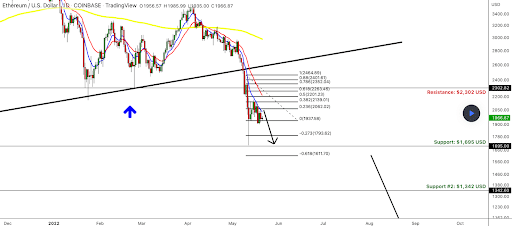
The ETH/USD 1D chart below by harisonhbn9718 shows ETH’s price trading between 0.236 [$2,062.02] and 0.382 [$2,139.01].
If Ether bulls want to seize the announcement of the Merge potentially taking place in August, they need to regain 0.382 and then 0.5 fib level [$2,201.23]. The next target for bullish ETH traders is 0.618 [$2,263.45].
Conversely, bearish traders are looking to send ETH’s price back below the 0.236 followed by 1 [$1,937.58]. The third target below for bearish ETH market participants is 0.273 [$1,793.62].
ETH’s 24 hour price range is $1,970.69-$2,049.57 and its 7 day price range is $1,915.18-$2,147.05. Ether’s 52 week price range is $1,719-$4,878.
Ether’s Moving Averages: 5-Day [$2,004.72], 20-Day [$2,455.04], 50-Day [$2,836.96], 100-Day [$2,875.62], 200-Day [$3,347.90], Year to Date [$2,875.62].
The price of ETH on this date in 2021 was $2,094.28.
The average price of ETH for the last 30 days is $2,477.89 and ETH’s -32.47% over the same timespan.
Ether’s price [+3.45%] closed its daily candle on Sunday worth $2,043.28 and in green figures for a second day in a row.
Theta Analysis
Theta’s price also received some bullish relief during Sunday’s daily session and concluded the day +$0.06.
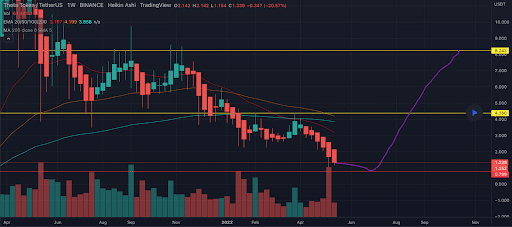
The third chart we’re analyzing today is the THETA/USDT 1W chart below from Stretchio. Traders can see that bullish traders have support at the $0.79 level and bulls risk seeing that price level soon if they don’t manage to pivot to the upside.
The overhead level to break for bullish traders to once again be in some sort of control of Theta’s price and the market’s momentum is the $4.38 level.
Theta’s Moving Averages: 5-Day [$1.28], 20-Day [$1.96], 50-Day [$61.55], 100-Day [$201.77], 200-Day [$409.71], Year to Date [$201.77].
Theta’s 24 hour price range is $1.23-$1.32 and its 7 day price range is $1.18-$1.47. Theta’s 52 week price range is $1.03-$15.72.
Theta’s price on this date last year was $5.91.
The average price of THETA over the last 30 days is $2.02 and THETA’s -60.69% for the same time frame.
Theta’s price [+5.06%] closed its daily candle worth $1.31 on Sunday and in green digits for a second straight day.