Summary
Bitcoin Analysis
Bitcoin’s price traded sideways on Sunday and finished marginally in green figures for a second consecutive day. BTC’s price finished Sunday’s daily session +$46.4.
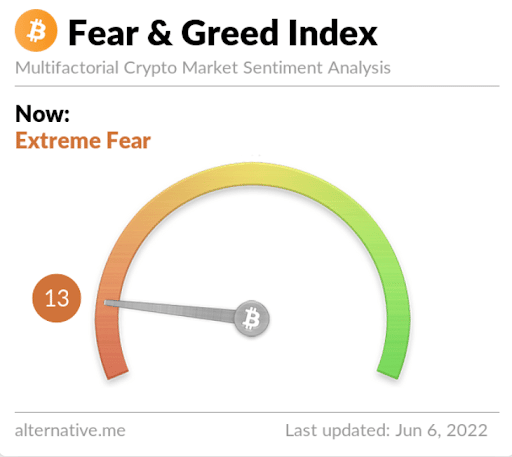
Bullish BTC market participants also finally stopped the streak of red weekly candles at nine consecutive by finishing last week’s candle in green figures.
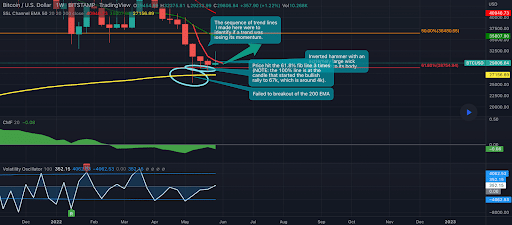
The BTC/USD 1W chart below from lorinstocksinvesting shows BTC’s price trading in between the 61.80% fibonacci level [$28,754.94] and 50.00% fib level [$36,480.55], at the time of writing.
Despite wicking down below the 61.80% fib level in the last few weeks, BTC’s price has rallied back above the $29k level. Bullish BTC traders are hoping to once again test the $32k level and if they can overcome local resistance there to then work their way up to test the 50.00% fib level.
The chartist posits that it might be time for a bullish price reversal noting that BTC’s price hit the 200 EMA but didn’t bearishly crossover. They also cite BTC’s price hitting the 61.8% fib level and the downtrend’s momentum waning or stalling over the last few weeks as evidence for a possible reversal.
Bitcoin’s Moving Averages: 5-Day [$30,504.60], 20-Day [$29,825.49], 50-Day [$36,844.70], 100-Day [$38,657.89], 200-Day [$45,497.26], Year to Date [$39,100.32].
BTC’s 24 hour price range is $29,609-$30,134 and its 7 day price range is $29,360-$32,206. Bitcoin’s 52 week price range is $26,600-$69,044.
The price of Bitcoin on this date last year was $34,140.
The average price of BTC for the last 30 days is $30,557.3 and BTC’s price is -24.7% over the same duration.
Bitcoin’s price [+0.16%] closed its daily candle worth $29,923.4 on Sunday.
Ethereum Analysis
Ether’s price also finished marginally in positive figures on Sunday and ETH’s price concluded its daily session +$1.57 per unit.
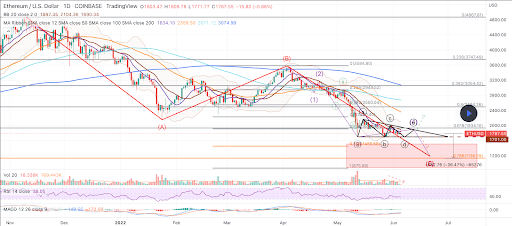
The ETH/USD 1D chart below by Crypto-Swing shows ETH’s price trading between 0.786 [$1,136.59] and 0.618 [$1,934.10], at the time of writing.
The primary overhead targets for bullish Ether market participants are 0.618, 0.5 [$2,404.26], and 0.382 [$3,054.42].
Conversely, bearish traders are looking to push ETH’s price below 0.786 before a potential test of the $1k level again and a trip back to three figures may ensue.
ETH’s 24 hour price range is $1,780.12-$1,827.8 and its 7 day price range is $1,751.16-$1,996.8. Ether’s 52 week price range is $1,707.56-$4,878.
The price of ETH on this date in 2021 was $2,712.42.
The average price of ETH for the last 30 days is $2,044.92 and ETH’s price is -38.44% over the same timespan.
Ether’s price [+0.09%] closed its daily candle on Sunday worth $1,806.14 and has finished in green figures for two straight days.
Tron Analysis
Tron’s price continues to be one of the few outliers working against the macro cryptocurrency sector’s current price action and momentum. Tron’s price is +36.6% against The U.S. Dollar for the last 90 days while BTC’s price is -23.17% over the same duration, at the time of writing.
TRX bulls got back on track on Sunday after finishing Friday and Saturday’s daily sessions in red figures. TRON finished Sunday’s daily session +$0.00108.
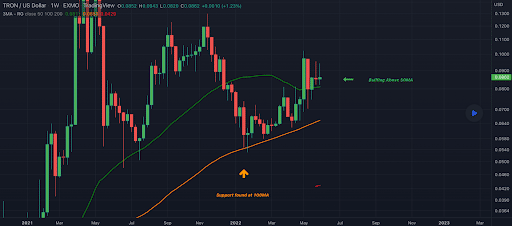
The last chart we’re looking at to start the new week is the TRON/USD 1W chart below by Bixley.
TRX’s price is bull flagging above the 50MA as shown below. TRX’s chart is arguably as strong as any chart on the weekly time frame across the top 50 cryptocurrency projects by market capitalization.
We can also see that TRX’s price has strong support from bullish traders at the 100MA. TRX’s price is doing encouraging things for bullish traders from a technical standpoint and bidders are still present.
TRX’s Moving Averages: 5-Day [$0.082], 20-Day [$0.077], 50-Day [$0.070], 100-Day [$0.066], 200-Day [$0.079], Year to Date [$0.066].
Tron’s 24 hour price range is $0.079-$0.082 and its 7 day price range is $0.077-$0.90. TRX’s 52 week price range is $0.048-$0.129.
Tron’s price on this date last year was $0.077.
The average price of TRX over the last 30 days is $0.078 and TRX is -5.27% for the same timespan.
Tron’s price [+1.34%] closed its daily session worth $0.08149 on Sunday.


