Summary
Bitcoin Analysis
Bitcoin’s price closed in red figures by a slim margin on Tuesday. BTC’s price sold-off drastically on the new daily candle on Tuesday but rallied during the day’s second 12 hour candle. After Tuesday’s session had concluded, BTC’s price was -$222.
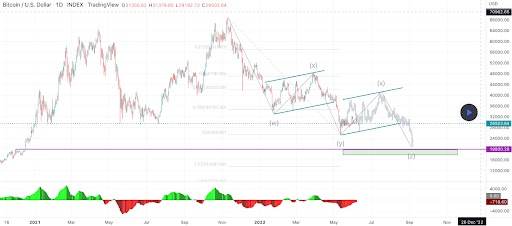
The first chart we’re analyzing today is the BTC/USD 1D chart below from q8tvsmart. BTC’s price is trading between the 1 fibonacci level [$25,365.62] and 0.786 [34,702.90], at the time of writing.
The bullish BTC market participants have their sights on reclaiming the 0.786 fib level with a secondary target of 0.618 [$42,033.09], and a third target of 0.5 [$47,181.69].
Bearish traders of the bitcoin market conversely are looking to send BTC’s price down to test the 1 fib level followed by a trip to test the 1.272 [$13,497.68] if they’re successful at the 1 fib level. The third target on the daily timescale is 1.414 [$7,301.92].
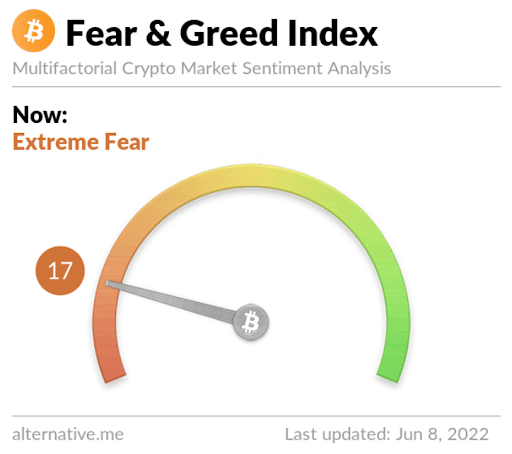
Bitcoin’s Moving Averages: 5-Day [$30,102.82], 20-Day [$29,772.52], 50-Day [$36,155.68], 100-Day [$38,426.37], 200-Day [$45,323.89], Year to Date [$38,946.65].
BTC’s 24 hour price range is $29,314-$31,522 and its 7 day price range is $29,314-$31,962. Bitcoin’s 52 week price range is $26,600-$69,044.
The price of Bitcoin on this date last year was $33,415.
The average price of BTC for the last 30 days is $30,222.8 and its -17.1% for the same duration.
Bitcoin’s price [-0.71%] closed its daily candle worth $31,149 on Tuesday and finished back in red figures after three consecutive days in green figures.
Ethereum Analysis
Ether’s price is failing to receive the same amount of bids that BTC’s been receiving and ETH finished Tuesday -2.53% and -$47.06.
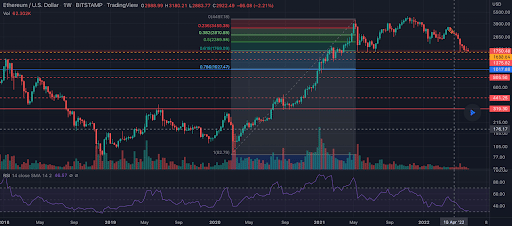
The ETH/USD 1W chart below by RighteousTA shows Ether’s price clinging to the 0.618 [$1,769.09] fibonacci level. Ether market participants of the bullish persuasion need to quickly retest 0.5 [$2,289.98] and break that level to the upside. If they do, bullish traders have a secondary target of 0.382 [$2,810.88] followed by a third target of 0.236 [$3,455.38].
Bearish Ether traders seek to push ETH’s price below the 0.618 fib level with a secondary target of 0.786 [$1,027.47].
ETH’s 24 hour price range is $1,730-$1,861 and its 7 day price range is $1,730-$1,965. Ether’s 52 week price range is $1,707-$4,878.
The price of ETH on this date in 2021 was $2,507.15.
The average price of ETH for the last 30 days is $1,988.38 and its -34.08% for the same timespan.
Ether’s price [-2.53%] closed its daily candle on Tuesday worth $1,812.94 and ETH also snapped three days in positive figures.
Axie Infinity Analysis
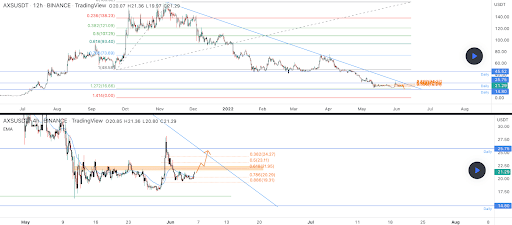
The third chart we’re analyzing today is the AXIE/USD 12HR chart below from plancton0618. AXIE’s price is trading between the 1.272 fibonacci level [$16.66] and 1 [$48.58], at the time of writing.
The obstacles above for bullish AXIE traders in terms of overhead resistance are the 1 fib, 0.786 [$73.69], 0.618 [$93.40], 0.5 [$107.25], and 0.382 [$121.09].
The targets for bearish AXIE traders to the downside are 1.272, and 1.414 [$0.00].
Axie’s 24 hour price range is $19.24-$20.8 and its 7 day price range is $19.24-$23.92. Axie’s 52 week price range is $2.85-$165.33.
Axie’s price on this date last year was $3.86.
The average price of AXS over the last 30 days is $21.43 and its -31.78% over the same time frame.
Axie Infinity’s price [-4.64%] closed its daily session on Tuesday worth $19.74.


