Summary
Bitcoin Analysis
Bitcoin’s price concluded Monday’s daily session -$1.9 and in red figures by the slimmest of margins. BTC’s price did however do something nice technically on Monday. Bullish traders successfully backtested the $19,891 level which was a former overhead resistance and now is a support level for the first time in bitcoin’s history.
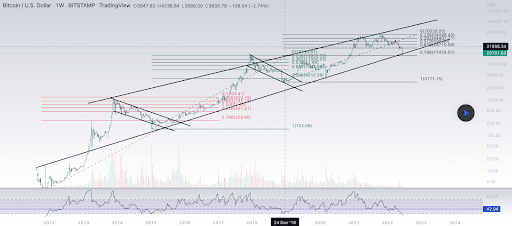
We’re leading off Tuesday’s price analyses with Bitcoin and the BTC/USD 1W chart below from sampaiotrader22. BTC’s price is trading between 0.786 [$17,478.57] and 0.618 [$28,710.09], at the time of writing.
Bullish BTC traders have targets of 0.618, 0.5 [$36,598.00], and 0.382 [$44,487.71].
Bearish BTC traders conversely are targeting 0.786 and a retracement to the 1 fib level [$3,171.75].

Bitcoin’s Moving Averages: 5-Day [$21,163.61], 20-Day [$27,564.99], 50-Day [$32,535.20], 100-Day [$37,209.93], 200-Day [$44,279.46], Year to Date [$37,871.49].
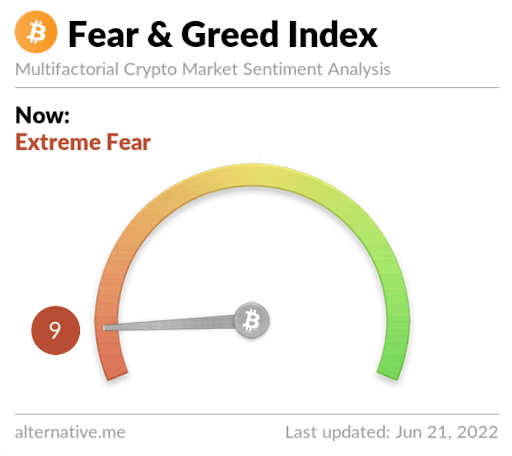
The Fear and Greed Index is 9 Extreme Fear and is equal to Monday’s reading.

BTC’s 24 hour price range is $19,626-$21,039 and its 7 day price range is $17,760-$22,930. Bitcoin’s 52 week price range is $17,611-$69,044.
The price of Bitcoin on this date last year was $31,761.
The average price of BTC for the last 30 days is $27,570.1 and its -317% over the same duration.
Bitcoin’s price [-0.01%] closed its daily candle worth $20,554.1 and in red figures.
Ethereum Analysis
Ether’s price also finished just down on the day and concluded its daily candle -$0.16.
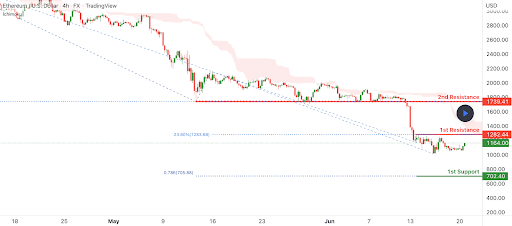
The second chart we’re looking at today is the ETH/USD 4HR chart below by desmondlzw. ETH’s price basically pivoted in the middle of its range and is still stuck there.
The range is between ETH’s current primary support of 0.786 [$705.88] and its primary overhead resistance of 23.60% [$1,283.68].
If bulls can regain the 23.60% fib the next target to the upside is $1,739.41 which should act as resistance on the way back to the upside of the chart.

Ether’s Moving Averages: 5-Day [$1,139.99], 20-Day [$1,634.39], 50-Day [$2,221.67], 100-Day [$2,582.24], 100-Day [$2,582.24], 200-Day [$3,167.21], Year to Date [$2,663.20].
ETH’s 24 hour price range is $1,053-$1,170 and its 7 day price range is $897.49-$1,244.52. Ether’s 52 week price range is $883.62-$4,878.
The price of ETH on this date in 2021 was $1,886.25.
The average price of ETH for the last 30 days is $1,653.09 and its -45.26% over the same timespan.
Ether’s price [-0.01%] closed its daily candle on Monday worth $1,128.29.
Chainlink Analysis
Chainlink’s price was the outlier of today’s asset analyses and LINK concluded its daily session +$0.37.
The LINK/USD 1D chart below from BuySellMarketMaker shows the primary profit taking level on the daily timescale if LINK pivots upward for a sustainable rally is $9.20. The chartist has a secondary take profit level of $11.40 followed by a third profit taking level of $13.35.
If bears have their way and crack the $6 level to the downside again, the chartist denotes a stop loss at $5.45.

LINK’s price is +44.1% against BTC and +77.15% against ETH over the last 30 days. This trend adds validity to those that believe LINK’s price is still an indicator to what’s forthcoming next for the crypto market.
Chainlink’s price peaked at $52.7 on May 10th, 2021 during the most recent bull market. BTC’s price peaked at $69,044 on November 10th, 2021 which was the same day ETH’s price topped at $4,878 for its cycle high. This means BTC and ETH may potentially be exactly six months behind LINK in terms of each asset’s bear market retracement.
LINK’s Moving Averages: 5-Day [$6.68], 20-Day [$7.25], 50-Day [$9.39], 100-Day [$12.43], 200-Day [$18.68], Year to Date [$14.03].
Chainlink’s 24 hour price range is $6.31-$7.29 and its 7 day price range is $5.48-$7.33. LINK’s 52 week price range is $5.32-$38.17.
Chainlink’s price on this date last year was $17.48.
The average price of LINK over the last 30 days is $7.12 and its -4.02% over the same time frame.
Chainlink price [+5.60%] closed its daily session on Monday worth $6.98 and in green figures for a second consecutive day.


