Summary
Bitcoin Analysis
Bitcoin’s price finished down nearly 2% for Sunday’s daily session and when traders settled up at the end of the day BTC was -$418.
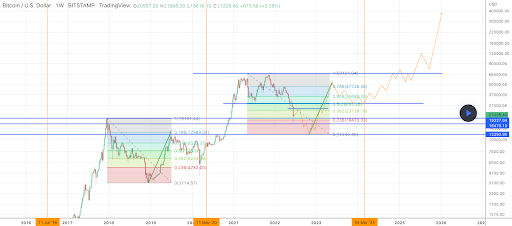
The first chart we’re analyzing for the new week is the BTC/USD 1W chart from Longbitcoin.
On the chart below, the three golden vertical lines denote each BTC halving event. The halving event is when BTC’s future emissions [block reward] is cut in half. BTC’s halving events are programmed into the code to take place after every 210,000 blocks that are mined on the bitcoin network.
BTC’s price is trading between 0.236 [$18,423.03] and 0.382 [$23,719.19], at the time of writing. Bullish traders are hoping to break the 0.382 with a secondary target of 0.618 [$35,685.00] and a third target of 0.786 [$47,726.58].
Bearish BTC traders are looking to send bitcoin’s price back below the 0.236 to retest multi-year lows at the $17k level. If traders are successful in making a new low their next target is eventually 0 [$12,245.46] on the weekly time frame.

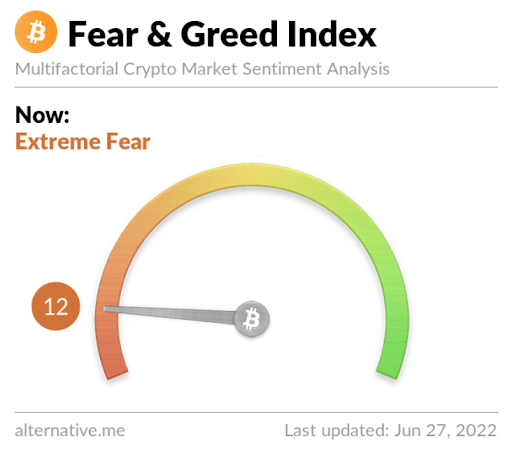
The Fear and Greed Index is 12 Extreme Fear and is -2 from Sunday’s reading of 14 Extreme Fear.

Bitcoin’s Moving Averages: 5-Day [$20,629.12], 20-Day [$25,812.10], 50-Day [$30,959.13], 100-Day [$36,499.94], 200-Day [$43,746.47], Year to Date [$37,318.03].
BTC’s 24 hour price range is $20,932-$22,020 and its 7 day price range is $19,864-$22,020. Bitcoin’s 52 week price range is $17.611-$69,044.
The price of Bitcoin on this date last year was $34,717.
The average price of BTC for the last 30 days is $25,959.5 and its -27.6% over the same duration.
Bitcoin’s price [-1.95%] closed its daily candle worth $21,067 and BTC snapped a streak of three straight daily closes in green figures on Sunday.
Ethereum Analysis
Ether’s price also sold-off lower during Sunday’s daily session and Ether concluded the day -$43.98.
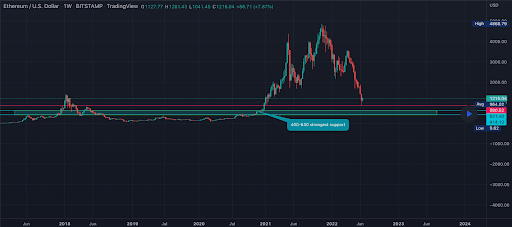
The second chart we’re analyzing this week is the ETH/USD 1W chart below by Richburst9. Ether bulls are trying to carve out further support at the $1,2k level on this timescale as historically there’s not much price support looking left.
If Ether bulls don’t continue this mini-reversal to the upside, the chartist denotes that the $400-$630 level is the strongest level of support to the downside.

Ether’s Moving Averages: 5-Day [$1,129.26], 20-Day [$1,484.80], 50-Day [$2,069.07], 100-Day [$2,516.67], 200-Day [$3,120.81], Year to Date [$2,614.05].
ETH’s 24 hour price range is $1,194.6-$1,280 and its 7 day price range is $1,049.65-$1,280. Ether’s 52 week price range is $883.62-$4,878.
The price of ETH on this date in 2021 was $1,980.35.
The average price of ETH for the last 30 days is $1,501.73 and its -37.17% over the same time frame.
Ether’s price [-3.54%] closed its daily candle on Sunday worth $1,197.82 and back in red figures after three consecutive green closes.
Cardano’s Analysis
Cardano’s price finished exactly 2% down on Sunday and -$0.01 for its daily session.
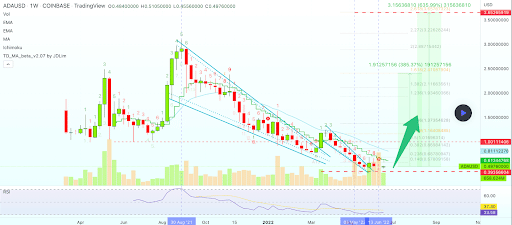
The third chart we’re analyzing today is the ADA/USD 1W chart below from AlanSantana. ADA’s price is trading below the 0.148 fib level [$0.578], at the time of writing.
Bullish ADA traders have targets to the upside of the chart of 0.236 [$0.687], 0.382 [$0.869], 0.5 [$1.01].
Conversely, the primary bearish target for skeptics is back to retest the $0.40 level. Below that level ADA market participants could be in for another steep markdown in price.

Cardano’s 24 hour price range is $0.489-$0.497 and its 7 day price range is $0.459-$0.523. ADA’s 52 week price range is $0.404-$3.09.
Cardano’s price on this date last year was $1.33.
The average price of ADA over the last 30 days is $0.525 and its -2.38% over the same timespan.
Cardnao’s price [-2.00%] closed its daily candle on Sunday worth $0.49 and ADA also broke a streak of three consecutive daily closes in positive figures.


