Summary
Bitcoin Analysis
Bitcoin’s price bounced back on Wednesday and concluded its daily session +$388.1. Wednesday’s close marked three daily candle closes in green figures out of the last four days for Bitcoin.
The first chart we’re analyzing for Thursday is the BTC/USD 1D chart below from Unity-Trading-Group. BTC’s price is trading between 0.00% [$17,644.61] and 23.60% [$21,151.87].
The overhead targets for bullish BTC traders are the 23.60% fib level, 38.20% [$23,321.61], 50.00% [$25,075.24].
Traders expecting further downside next are targeting 0.00% [$17,644.61] and -27.20% [$13,602.35].

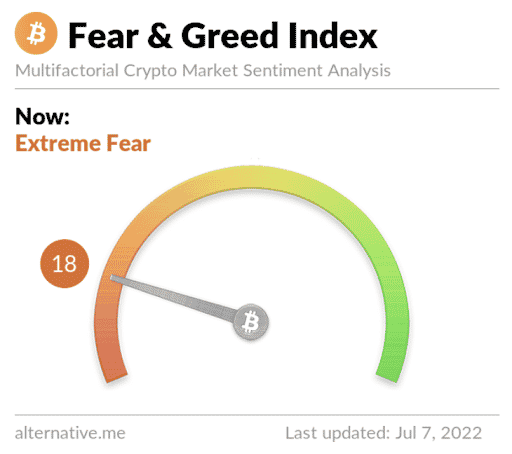
The Fear and Greed Index is 18 Extreme Fear and is even to Wednesday’s reading.

BTC’s 24 hour price range is $19,758-$20,665 and its 7 day price range is $18,817-$20,665. Bitcoin’s 52 week price range is $17,611-$69,044.
The price of Bitcoin on this date last year was $33,886.
The average price of BTC for the last 30 days is $22,585.1 and its -32.5% over the same duration.
Bitcoin’s price [+1.92%] closed its daily candle worth $20,557.1 on Wednesday.
Ethereum Analysis
Ether’s price outperformed BTC’s price by over 2% on Wednesday and when traders settled up at the daily session’s close ETH was +$52.45.
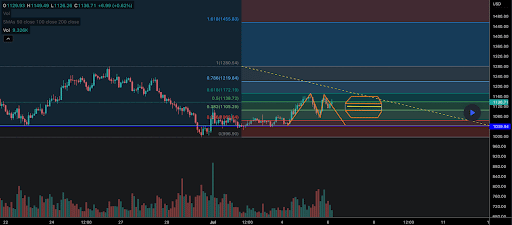
The second chart we’re analyzing today is the ETH/USD 2HR chart below by Hessinator. Ether’s price is trading between 0.618 [$1,172.19] and 0.786 [$1,219.84], at the time of writing.
Bullish ETH market participants are looking to break the 0.786 fib level followed by a secondary target of 1 [$1,280.54].
Traders looking for further downside first want to push ETH’s price below the 0.618 fib level with a secondary target of 0.5 [$1,138.72] and a third target of 0.382 [$1,105.25]. The fourth target to the downside for ETH bears is 0.236 [$1.063.84].

ETH’s 24 hour price range is $1,111.44-$1,205 and its 7 day price range is $1,010.15-$1,205. Ether’s 52 week price range is $883.62-$4,878.
The price of ETH on this date in 2021 was $2,317.13.
The average price of ETH for the last 30 days is $1,259.99 and its -36.81% over the same time frame.
Ether’s price [+4.63%] closed its daily candle on Wednesday worth $1,186.48 and in green figures for the fourth time over the last five days.
Solana Analysis
Buyer’s also controlled Solana’s price action on Wednesday and SOL also closed its daily session up over 4% and +$1.62.
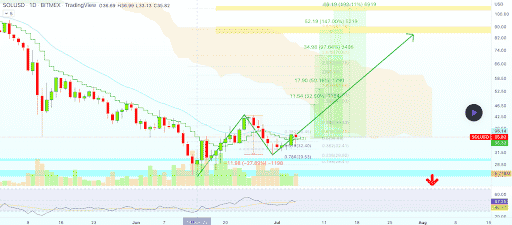
Today’s third chart is the SOL/USD 1D chart below from AlanSantana. SOL’s price is trading between the 0.5 fib level [$34.43] and 0.618 [$36.45].
Solana bulls need to exceed the 0.618 fib level first before they can focus on regaining 0.786 [$39.33] and 1.236 [$47.03].
The downside targets for bearish Solana market participants are the 0.5 fib level with a secondary target of 0.382 [$32.41] and a third target of 0.236 [$29.92].

Solana’s 24 hour price range is $34.8-$37.65 and its 7 day price range is $31.09-$37.65. Solana’s 52 week price range is $22.11-$259.96.
Solana’s price on this date last year was $36.69.
The average price of SOL over the last 30 days is $35.44 and its -5.78% over the same timespan.
Solana’s price [+4.57%] closed its daily session on Wednesday worth $37.04.


