Summary
Bitcoin Analysis
Bitcoin’s price continued to suffer from more bearish selling pressure on Monday and BTC’s price concluded its daily session -$909.6.
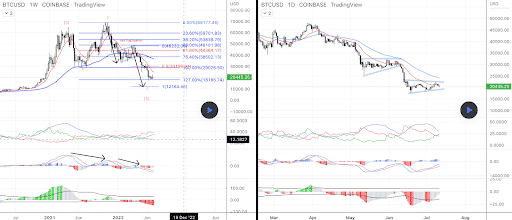
We’re looking at two BTC charts today, each chart is from Handymans. The first bitcoin chart today is the BTC/USD 1W chart below on the left. BTC’s price is trading between 127.00% [$18,185.74] and 100.00% [$29,026.50], at the time of writing.
The primary aim of bullish BTC market participants is to get back above the 100% fib level before shifting their focus to 76.40% [$38,502.13]. The third target for bullish BTC traders is 61.80% [$44,364.17].
From the bearish perspective, they’re hoping to again send BTC’s price back down to test the 127.00% fib level. If bears win that battle their next goal will be to break the 12-month low on BTC at $17,611.

If BTC’s price confirms a breakout of this pattern this week much lower prices could be forthcoming.
Bitcoin’s Moving Averages: 5-Day [$20,942.8], 20-Day [$20,607.61], 50-Day [$26,684.68], 100-Day [$34,068.04], 200-Day [$42,457.77], Year to Date [$35,946.94].
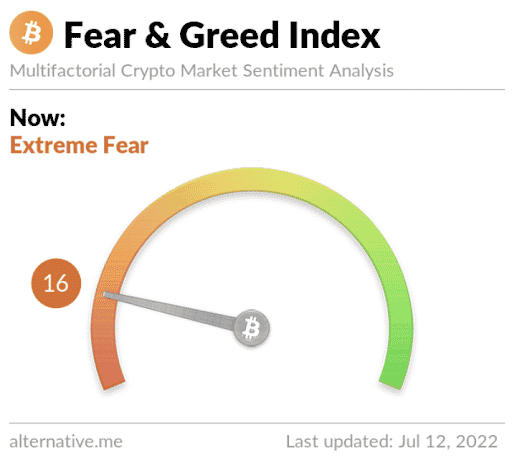
The Fear and Greed Index is 16 Extreme Fear and is -6 from Monday’s reading of 22 Extreme Fear.

BTC’s 24 hour price range is $19,800-$20,821 and its 7 day price range is $19,420-$22,109. Bitcoin’s 52 week price range is $17,611-$69,044.
The price of Bitcoin on this date last year was $33,090.
The average price of BTC for the last 30 days is $21,115.5 and its -29.9% over the same duration.
Bitcoin’s price [-4.36%] closed its daily candle worth $19,945 on Monday and in red figures for a fourth consecutive day.
Ethereum Analysis
Ether’s price underperformed BTC on Monday and traders sent ETH’s price lower again to finish its daily session -$70.9.
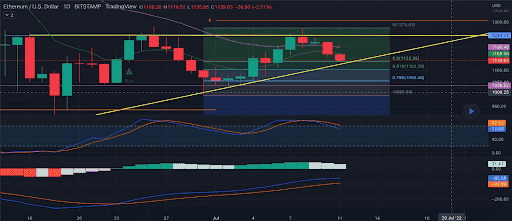
Today’s second chart is the ETH/USD 1D chart below by visiedo. Ether’s price is trading between 0.786 [$1,055.46] and 0.618 [$1,102.39], at the time of writing.
The targets on ETH above for bullish traders are 0.618, 0.5 [$1,135.35], and 0 [$1,275.03].
Bearish traders are eyeing a retracement back below the 0.786 fib level with the $1k level as a secondary target. The third target on ETH for bearish traders is 1 [$995.68].

ETH’s 24 hour price range is $1,086.66-$1,170.89 and its 7 day price range is $1,086.66-$1,260.46. Ether’s 52 week price range is $883.62-$4,878.
The price of ETH on this date in 2021 was $2,032.26.
The average price of ETH for the last 30 days is $1,166.69 and its -31.42% over that timespan.
Ether’s price [-6.07%] closed its daily candle on Monday worth $1,096.45 and in red figures for the second day in a row.
Cosmos Analysis
ATOM’s price also dropped lower on Monday and when traders settled-up at the daily session’s close Cosmos was -$0.59.
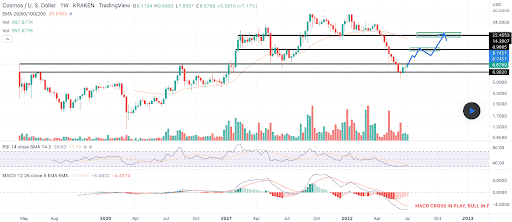
We’re rounding out our price analyses for Tuesday with the ATOM/USD 1W chart below from investmox.
Bullish Cosmos traders are happy about their success over the last 30 days and are now focusing on getting back into double digits. The levels overhead for bullish ATOM traders are $14.20 and $22.45.
For bears, their primary target on Cosmos is the $6.90 level.

ATOM’s Moving Averages: 5-Day [$9.10], 20-Day [$7.79], 50-Day [$9.88], Year to Date [$15.50].
ATOM’s price is +19.16% against The U.S. Dollar over the last 30 days, +65.85% against BTC, and +59.09% against ETH, over the same duration.
ATOM’s 24 hour price range is $8.13-$9.11 and its 7 day price range is $8.13-$9.53. The 52 week price range of Cosmos is $5.55-$44.67.
ATOM’s price on this date last year was $12.99.
The average price of ATOM over the last 30 days is $7.75 and its -10.86% over the same time frame.
ATOM’s price [-6.73%] closed its daily session on Monday worth $8.18 and red figures for a second consecutive day.


