Summary
Bitcoin Analysis
On Tuesday, bulls again failed to put an end to incessant selling pressure from bearish traders and BTC’s price concluded its daily session -$634.5. BTC’s price also closed below $19,891 which is an important level of inflection dating back to BTC’s all-time high of 2017.
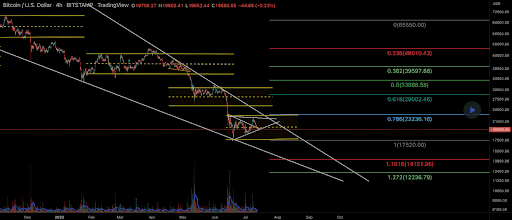
We’re leading-off Wednesday’s price analyses with bitcoin as always and the BTC/USD 4HR chart below by Emvo10. BTC’s price is trading between the 1 fibonacci level [$17,520.00] and 0.786 [$23,236.16], at the time of writing.
Traders expecting or hoping for upside on BTC firstly are aiming for 0.786, followed by 0.618 [$29,002.46], and 0.5 [$33,888.58].
Bearish traders are conversely looking to push BTC’s price below a 12-month low at the 1 fibonacci level with a secondary target of 1.618 [$14,151.96]. The third target for bearish traders is the 1.272 fib level [$12,236.79].

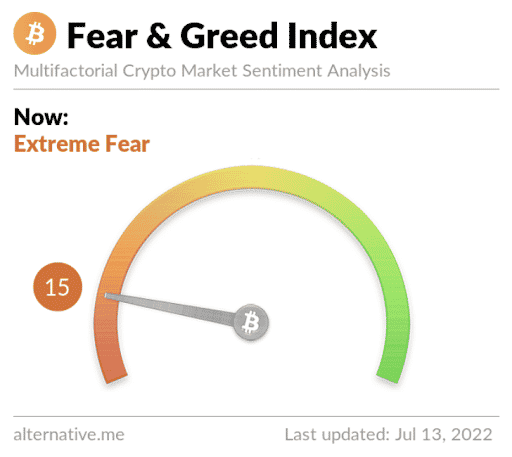
The Fear and Greed Index is 15 Extreme Fear and is -1 from Tuesday’s reading of 16 Extreme Fear.

BTC’s 24 hour price range is $19,216-$20,038 and its 7 day price range is $19,216-$22,109. Bitcoin’s 52 week price range is $17,611-$69,044.
The price of Bitcoin on this date last year was $32,727.
The average price of BTC for the last 30 days is $20,810.4 and its -31.7% over the same time frame.
Bitcoin’s price [-3.18%] closed its daily candle worth $19,310.5 and in red figures for a fifth consecutive day on Tuesday.
Ethereum Analysis
Ether’s price traded lower at close than at open again on Tuesday and concluded its daily candle -$57.82.
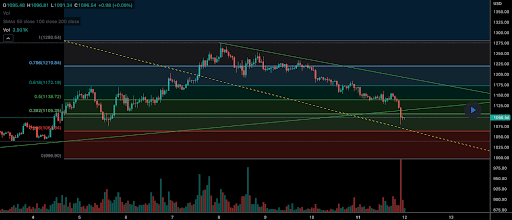
The second chart we’re looking at for Tuesday is the ETH/USD 1HR chart below from Hessinator. ETH’s price is trading between the 0.236 fibonacci level [$1,063.84] and 0.382 [$1,105.25], at the time of writing.
Bullish Ether market participants are trying to hold off bears at or above the 0.236 fib level before a potential rally. The targets to the upside for bullish ETH traders are 0.382, 0.5 [$1,138.72], and 0.618 [$1,172.19].
At variance with bulls are bearish ETH traders that want to crack the 0.236 fib level and again push ETH’s price below the $1k level. The third target for bearish traders to the downside of the 1HR chart is a full retracement at 0 [$996.90].

Ether’s Moving Averages: 5-Day [$1,169.29], 20-Day [$1,134.80], 50-Day [$1,638.35], 100-Day [$2,297.73], 200-Day [$3,005.64], Year to Date [$2,484.91].
ETH’s 24 hour price range is $1,033-$1,098 and its 7 day price range is $1,033-$1,260. Ether’s 52 week price range is $883.62-$4,878.
The price of ETH on this date in 2021 was $1,940.99.
The average price of ETH for the last 30 days is $1,149.52 and its -31.88% over the same duration.
Ether’s price [-5.27%] closed its daily candle on Tuesday worth $1,038.63 and in red figures for the third day in a row.
Elrond Analysis
Elrond’s price outperformed the other projects we’ve analyzed today but still finished in negative figures on Tuesday and -$1.09.
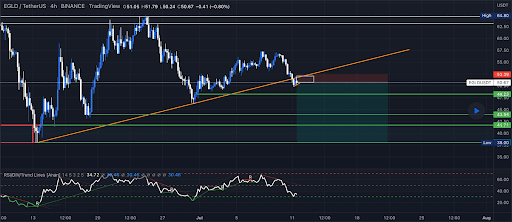
The third chart we’re dissecting for Wednesday is the EGLD/USD 4HR chart below from TradeWMaya.
This chart shows Elrond’s price breaking down below an important trendline with support at the $48 level. Bullish traders want to reclaim the territory above that trendline or they could suffer from much steeper downside soon.
The support levels below for bullish EGLD market participants are the $48.23 level, $43.94 level, and $41.71 level.

Elrond’s Moving Averages: 5-Day [$52.03], 20-Day [$54.12], 50-Day [$70.71], Year to Date [$105.63].
Elrond’s 24 hour price range is $49.02-$50.89 and its 7 day price range is $49.02-$57.17. Elrond’s 52 week price range is $38.07-$542.07.
Elrond’s price on this date last year was $85.7.
The average price of EGLD over the last 30 days is $53.2 and its -2.47% over the same timespan.
Elrond’s price [-2.17%] closed its daily session on Tuesday worth $49.24 and in red figures again for the third straight day.


