Summary
Bitcoin Analysis and the market news
Crypto market news: Bitcoin’s price held the $19,891 level on Wednesday and bullish traders climbed higher. BTC’s price also closed its candle up greater than 3% for a second straight daily session and was +$687 on Wednesday.
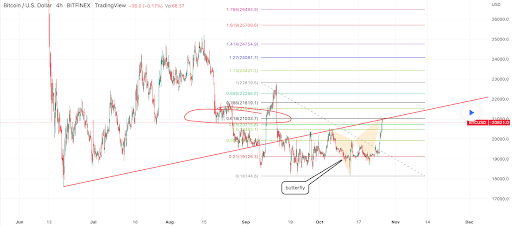
The first chart we’re digging into today is the BTC/USD 4HR chart below by LevRidge. BTC’s price is trading between the 0.55 fibonacci level [$20,715.8] and 0.618 fib level [$21,033.7], at the time of writing.
Bullish traders can finally focus on a primary objective that isn’t eclipsing BTC’s former all-time high of $19,891. We can see that after bullish traders broke above that level on Tuesday, BTC’s price marked up quickly and considerably.
The targets to the upside for bullish BTC traders now are 0.618, 0.72 [$21,529.2], 0.786 [$21,819.1], 0.886 [$22,286.6], 1 [$22,819.5], and 1.13 [$23,427.2] over the interim.
Conversely, bearish traders that still believe in more downside on BTC’s price have a primary aim of pushing its price below the 0.55 fib level followed by targets of 0.5 [$20,482.1], 0.382 [$19,930.4], 0.21 [$19,126.3], and finally a complete retrace at 0 [$18,144.6].
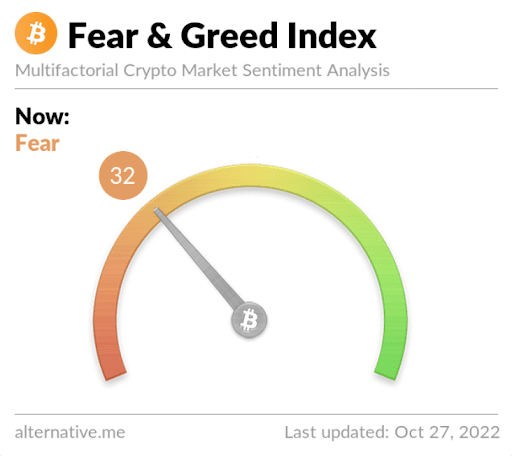
Bitcoin’s Moving Averages: 5-Day [$19,708.53], 20-Day [$19,554.58], 50-Day [$19,940.86], 100-Day [$21,061.38], 200-Day [$29,695.23], Year to Date [$30,517.2].
BTC’s 24 hour price range is $20,035-$21,020 and its 7 day price range is $18,788.33-$21,020. Bitcoin’s 52 week price range is $17,611-$69,044.
The price of Bitcoin on this date last year was $58,453.
The average price of BTC for the last 30 days is $19,434.9 and its +9.3% over the same period.
Bitcoin’s price [+3.42%] closed its daily candle worth $20,768.4 on Wednesday and in green figures for the fifth time over the last six days.
Ethereum Analysis
Ether’s price marked up more than 7% for a second day in a row on Wednesday and when traders settled-up at its session’s close, ETH’s price was +$106.6.
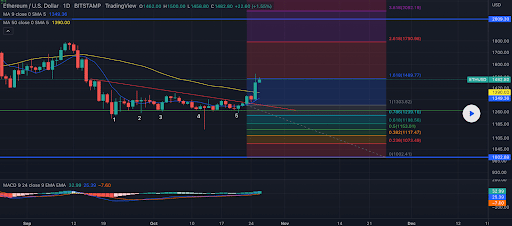
The ETH/USD 1D chart below by Cryptoslothx is the second chart we’re providing analysis for this Wednesday. ETH’s price is trading between the 1.618 fib level [$1,489.77] and 2.618 [$1,790.98], at the time of writing.
Similarly to BTC’s price, ETH’s price has regained its 2017 ATH and bullish traders are seeking further upside. Their targets above are the 2.618 fib level and the 3.618 fib level [$2,092.19] on the daily timescale.
Contrariwise, those shorting the Ether market want to push ETH’s price again below the 1.618 fib level followed by targets of 1 [$1,303.62], 0.786 [$1,239.16], 0.618 [$1,188.56], 0.5 [$1,153.01], 0.382 [$1,117.47], 0.236 [$1,073.49], and 0 [$1,002.41].
ETH’s 24 hour price range is $1,457.25-$1,594.99 and its 7 day price range is $1,264.48-$1,594.99. Ether’s 52 week price range is $883.62-$4,878.
The price of ETH on this date in 2021 was $3,921.72.
The average price of ETH for the last 30 days is $1,327.52 and its +17.86% over the same interval.
Ether’s price [+7.30%] closed its daily candle on Wednesday valued at $1,566.13 and in green digits also for a fifth time in six days.
Solana Analysis
Solana’s price marked up cumulatively over Tuesday and Wednesday more than 10% and SOL concluded its day +$0.42 for Wednesday’s session.
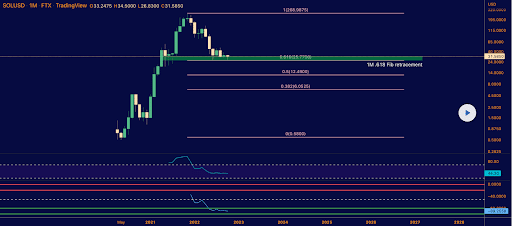
The final chart for analysis this Thursday is the SOL/USD 1M chart from userfan. Solana’s price is trading between the 0.618 fib level [$25.77] and 1 fib level [$268.98], at the time of writing.
The 0.618 fib level marks nearly a 90% retracement from SOL’s ATH made on November 6th, 2021. The asset’s -88% from its cycle peak [at the time of writing] and bullish traders want to again revisit the 1 fib level on the monthly time frame.
In defiance of bullish SOL market participants are bearish traders that believe there’s still further downside on the asset. The targets for those traders are 0.618, 0.5 [$12.49], 0.382 [$6.05], and a full retracement at 0 [$0.58].
Solana’s 24 hour price range is $30.63-$32.17 and its 7 day price range is $27.22-$32.17. SOL’s 52 week price range is $25.97-$259.96.
Solana’s price on this date last year was $184.38.
The average price of SOL over the last 30 days is $31.4 and its -6.38% for the same period.
Solana’s price [+1.36%] closed its daily session on Wednesday worth $31.3 and in green figures for a second straight day.


