Bitcoin Analysis
Bitcoin’s price continued to struggle on Wednesday amid another 0.75 basis point interest rate hike by the Federal Reserve.
BTC’s price saw a lot of volatility around the time of FED Chairman Jerome Powell’s press conference and when traders settled-up to paint Wednesday’s daily candle, BTC’s price was -$329.2.
The BTC/USD 1M chart below by FiboSwanny is the first chart we’re analyzing for this Thursday.
BTC’s price is trading between the 0.00% fibonacci level [$17,567.45] and 38.20% fib level [$29,284.36], at the time of writing.
Bullish traders have a primary target of exceeding the 38.20% fib level followed by targets of 61.80% [$36,529.03], 100.00% [$48,240.00], 127.20% [$56,582.93], 141.40% [$60,938.44], and 200.00% [$78,912.55].
At variance with bullish BTC market participants are bearish traders that believe further downside is imminent this month.
Their targets to the downside of the monthly timescale are to send BTC’s price again below an important level of inflection [$19,891] followed by the 0.00% fib level.


Bitcoin’s Moving Averages: 5-Day [$20,470.66], 20-Day [$19,728.60], 50-Day [$19,807.96], 100-Day [$20,822.29], 200-Day [$29,267.47], Year to Date [$30,286.75].
BTC’s 24 hour price range is $20,048-$20,800 and its 7 day price range is $20,048-$20,924.82. Bitcoin’s 52 week price range is $17,611-$69,044.
The price of Bitcoin on this date last year was $62,904.
The average price of BTC for the last 30 days is $19,704.7 and its +5.2% over the same interval.
Bitcoin’s price [-1.61%] closed its daily candle worth $20,154.5 and in red figures for a fourth consecutive day on Wednesday.
Summary
Ethereum Analysis
Ether’s price followed Tuesday’s green candle with a red candle on Wednesday and when the day’s session concluded, ETH’s price was -$58.86.
The second chart we’re examining today is the ETH/USDT 1D chart from AlgoBuddy.
ETH’s price is still stuck below an important range on ETH’s daily time frame.
For bullish Ether market participants to continue their ascent and attempt to regain the $2k level, they’ll need to crack the bottom of the overhead range at $1,700 before breaking the top of it at the $1,800 level.
We can see looking left on the 1D chart, historically ETH’s price has a great deal of respect for this range.

Ether’s Moving Averages: 5-Day [$1,557.84], 20-Day [$1,393.50], 50-Day [$1,447.42], 100-Day [$1,445.26], 200-Day [$2,034.97], Year to Date [$2,125.88].
ETH’s 24 hour price range is $1,502.32-$1,621.68 and its 7 day price range is $1,496.98-$1,645.08. Ether’s 52 week price range is $883.62-$4,878.
The price of ETH on this date in 2021 was $4,602.42.
The average price of ETH for the last 30 days is $1,379.45 and its +17.25% over the same stretch.
Ether’s price [-3.73%] closed its daily session on Wednesday worth $1,520.77 and in negative figures for the third time over the last four days.
Quant (QNT) crypto price analysis
Quant’s crypto price also marked-down on Wednesday and concluded its daily session -$4.5.
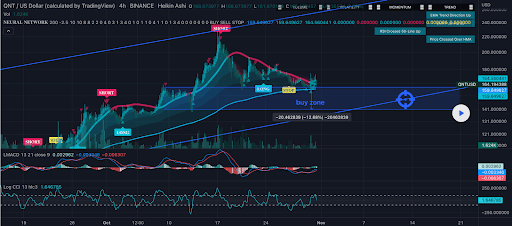
The QNT/USD 4HR chart by CBKWahoo is the third chart we’re looking at today. Quant’s price is trading above the $155 level and is -10.57% for the last 7 days, at the time of writing.
The chartist denotes that QNT’s price is in a buy-zone that has a range of $140-$161 on the 4HR timescale.
Those that have been following Quant over the last month know that the buy-zone outlined below correlates with where QNT’s price was suggesting it could land during a pullback from its recent high of $226.


QNT’s price has finished 16 of the last 30 days in green figures.
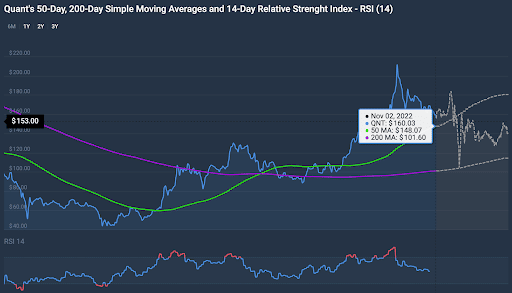
Quant’s 24 hour price range is $154.2-$165 and its 7 day price range is $154.2-$176.15. QNT’s 52 week price range is $40.5-$314.6.
Quant’s price on this date last year was $267.
The average price of QNT over the last 30 days is $163.13 and its +10.08% over the same span.
Quant’s price [-2.77%] closed its daily candle on Wednesday worth $158.2 and in negative digits for a third day in a row.


