Bitcoin Analysis
It’s been 405 days since Bitcoin’s all-time high [$69,044] and 2022 has been largely controlled by bearish traders. On Monday, bearish BTC traders again set the tone for the market’s action and when the day concluded, BTC’s price was -$299.4.
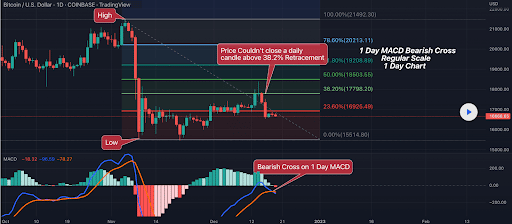
We’re beginning Tuesday’s price analyses with the BTC/USD 1D chart by NeutronMan. BTC’s price is trading between the 0.00% fibonacci level [$15,514.8] and 23.60% fib level [$16,925.49], at the time of writing.
After Bitcoin bulls failed to close above the 38.20% fib level on the daily timescale, bearish traders were able to reverse BTC’s price action to the downside. The levels for bullish traders to seize control of Bitcoin’s price action above the 23.60% level are 38.20% [$17,798.2], 50.00% [$18,503.55], 61.80% [$19,208.89], 78.60% [$20,213.11] and the 100.00% fib level [$21,492.3].
Bearish traders of Bitcoin’s market have a primary aim of retesting BTC’s multi-year low at the 0.00% fibonacci level. If they can capitalize on the bearish cross that formed on the 1D MACD and continue their assault on bullish traders, then the bottom of the bear market may yet to be established.
Bitcoin’s Moving Averages: 5-Day [$17,306.95], 20-Day [$16,908.34], 50-Day [$18,069.93], 100-Day [$19,500.25], 200-Day [$25,446.41], Year to Date [$28,566.82].
BTC’s 24 hour price range is $16,256.3-$16,816 its 7 day price range is $16,256.3-$18,320.82. Bitcoin’s 52 week price range is $15,501-$52,027.
The price of Bitcoin on this date last year was $46,898.
The average price of BTC for the last 30 days is $16,838.4 and its +0.02% for the same interval.
Bitcoin’s price [-1.79%] closed its daily candle worth $16,441.2 and in red figures for a second straight day on Monday.
Summary
Ethereum Analysis
Ether’s price followed the macro cryptocurrency market lower again on Monday and when traders settled-up for the session’s close, ETH’s price was -$14.82.
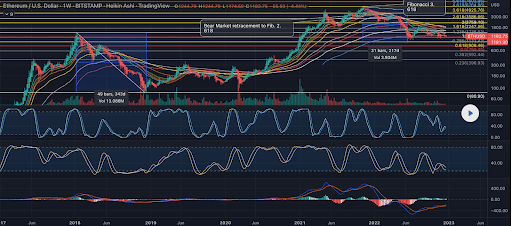
The ETH/USD 1W chart below from mxlockwood96 is where we shift our focus to next. At the time of writing, ETH’s price is nestled between the 0.786 fib level [$1,133.43] and 1 [$1,420.00].
On the weekly timescale bullish Ether market participants have overhead targets of 1, 1.236 [$1,736.03], 1.618 [$2,247.56], 2 [$2,759.10], and the 2.618 fib level [$3,586.66].
Conversely, those that are more pessimistic about what’s forthcoming for Ether’s price have targets below of 0.786, 0.618 [$908.46], 0.5 [$750.45], 0.382 [$592.44], and 0.236 [$396.93].
ETH’s 24 hour price range is $1,150.51-$1,1951 and its 7 day price range is $1,150.51-$1,343.42. Ether’s 52 week price range is $883.62-$4,148.85.
The price of ETH on this date in 2021 was $3,944.49.
The average price of ETH for the last 30 days is $1,227.99 and its -1.96% over the same time frame.
Ether’s price [-1.25%] closed its daily session on Monday worth $1,167.82 and in negative digits for the sixth time in seven days.
Shiba Inu Analysis
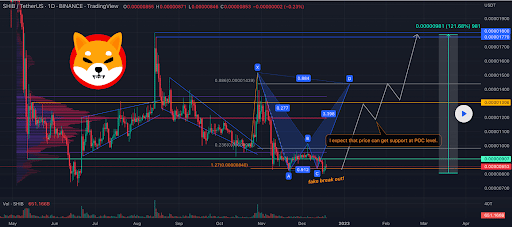
The SHIB/USDT 1D chart from YongTung is the last chart we’re analyzing for this Monday and it shows a false breakout on the daily timescale for SHIB.
Bullish market participants were unable to hold the 1.27 fib level [$0.00000840]. If bulls can regain momentum and the 1.27 fib level then the targets above are 0.236 [$0.00000983], and 0.886 [$0.000001439].
If bearish traders that are shorting SHIB continue to have their way, their eventual target is a retest of SHIB’s 12-month low [$$0.00000716].
Shiba Inu’s Moving Averages: 5-Day [$0.000009], 20-Day [$0.000009], 50-Day [$0.000010], 100-Day [$0.000011], 200-Day [$0.000014], Year to Date [$0.000016].
SHIB’s price is -73.94% against the U.S. Dollar for the last 12 months, -25.31% against BTC, and -11.72% against ETH over the same period.
Shiba Inu’s 24 hour price range is $0.00000793-0.00000878 and its 7 day price range is $0.00000793-$0.00000928. SHIB’s 52 week price range is $0.00000716-$0.00003986.
Shiba Inu’s price on this date last year was $0.00003120.
The average price of SHIB over the last 30 days is 0.00000900 and its -11.2% over the same stretch.
Shiba Inu’s price [-4.68%] closed its daily candle on Monday worth $0.00000815 and in red figures for the first time in three days.


