Bitcoin Analysis
Bitcoin’s price pulled back slightly on Wednesday and concluded the day’s trading session -$80.
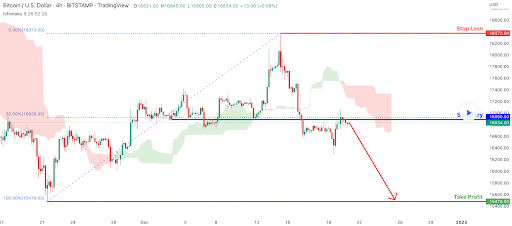
The BTC/USD 4HR chart below by FXCM is the first chart we’re examining for this Thursday. BTC’s price is trading between the 100.00% fibonacci level [$15,479.00] and 50.00% [$16,926.00], at the time of writing.
BTC’s price is trading just below the 50.00% fibonacci level despite the Total Market Cap bullishly engulfing on Tuesday. If bullish market participants can take back the 50.00% fib level then their next target is back to where bears caused the most recent breakdown in BTC’s price at the 0.00% [$18,373.00].
At variance with bullish traders are those that are shorting BTC’s price, they’ve a primary target of the 100.00% fib level [$15,479.00].


Bitcoin’s Moving Averages: 5-Day [$16,905.13], 20-Day [$16,957.19], 50-Day [$17,977.92], 100-Day [$19,372.59], 200-Day [$25,210.89], Year to Date [$28,473.75].
BTC’s 24 hour price range is $16,750-$16,930 and its 7 day price range is $16,750-$16,937.02. Bitcoin’s 52 week price range is $15,501-$52,027.
The price of Bitcoin on this date last year was $48,626.
The average price of BTC for the last 30 days is $16,843.2 and its +0.9% for the same stretch.
Bitcoin’s price [-0.47%] closed its daily candle worth $16,845 and in red figures for the third time over the last four days.
Summary
Ethereum Analysis
Ether’s price also marked-down less than 1% on Wednesday and when ETH’s daily candle was printed, ETH’s price was -$3.26.
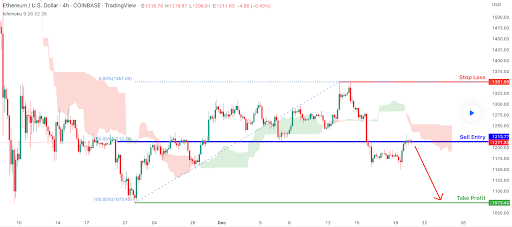
The second chart we’re analyzing this Thursday is the ETH/USD 4HR chart from desmondlzw. At the time of writing, ETH’s price is nestled between the 100.00% fibonacci level [$1,073.42] and 50.00% fib level [$1,212.24].
The levels of control for bullish traders to reclaim short-term momentum are the 50.00% fib level and the 0.00% fibonacci level [$1,351.05].
Bearish traders conversely have a primary target of the 100.00% fib level [$1,073.42].

ETH’s 24 hour price range is $1,203.02-$1,223.39 and its 7 day price range is $1,203.02-$1,223.39. Ether’s 52 week price range is $883.62-$4,148.85.
The price of ETH on this date in 2021 was $3,979.47.
The average price of ETH for the last 30 days is $1,227.69 and its -0.34% over the same duration.
Ether’s price [-0.27%] closed its daily session on Wednesday worth $1,213.92 and in negative figures for the sixth time over the last eight days.
Monero Analysis
Monero’s price was the lone performer for today’s price analyses that closed Wednesday in positive digits and XMR’s price finished the day +$0.40.
The XMR/USD 1M chart below by StrejdaCZ2020 is the chart we’re concluding this Thursday’s price analyses. XMR’s price is trading between the 2 fibonacci level [$138.34] and 2.25 fib level [$263.57], at the time of writing.
The chartist posits that XMR’s price may be forming a Head & Shoulders pattern which would potentially take Monero’s price up to the 2.5 fib level [$502.16]. Bullish XMR market participants must first regain the 2.25 fib level if they hope to see the $500 level again for the first time since January 9th, 2018.
If bearish traders are successful however, they’ll negate the Head & Shoulders pattern and send Monero’s price back down to retest the 2 fib level. Below the 2 fib level are targets of 1.74 [$70.77], 1.5 [$38.11], 1.25 [$20.00], and the 1 fibonacci level [$10.50].

Monero’s price on this date last year was $190.60.
The average price of XMR over the last 30 days is $142.55 and its +9.37% over the same interval.
Monero’s price [+0.27%] closed its daily candle on Wednesday worth $147.20 and in green figures for the fourth time in five days.


