Bitcoin Analysis
Bitcoin’s price started the new week in positive digits and when traders settled-up to conclude Monday’s trading session, BTC’s price was +$86.4.
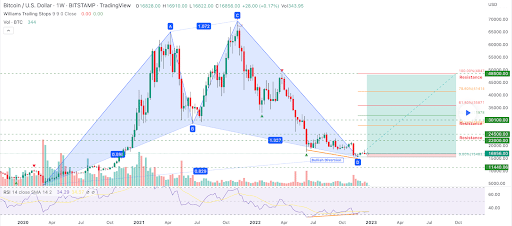
The BTC/USD 1W chart below from EngrQ_47 is where we’re leading off our price analyses this week. At the time of writing, BTC’s price is trading between the 0.00% fibonacci level [$15,483.30] and 38.20% fib level [$28,085.82].
The overhead targets for bullish market participants of Bitcoin on the weekly time frame are 38.20%, 50.00% [$31,978.74], 61.80% [$35,871.66], 78.60% [$41,414.13], and the 100.00% fibonacci level [$48,474.18].
Conversely, bearish traders that are pursuing further downside for BTC’s price have a primary aim of the 0.00% fib level which is Bitcoin’s multi-year low on the BITSTAMP chart.
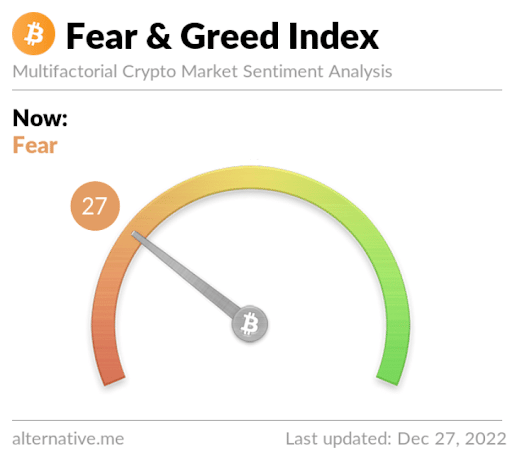
Bitcoin’s Moving Averages: 5-Day [$16,824.26], 20-Day [$17,014.77], 50-Day [$17,824.21], 100-Day [$19,180.87], 200-Day [$24,844.58], Year to Date [$28,336.98].
BTC’s 24 hour price range is $16,791-$16,924 and its 7 day price range is $16,791-$16,961.42. Bitcoin’s 52 week price range is $15,505-$52,008.2.
The price of bitcoin on this date last year was $50,700.
The average price of BTC for the last 30 days is $16,915.7 and +1.4% over the same duration.
Bitcoin’s price [+0.51%] closed its daily candle worth $16,918.2 and in green figures for the second time in three days on Monday.
Summary
Ethereum Analysis
Ether’s price marked-up as well during Monday’s trading session and finished the day +$8.97.
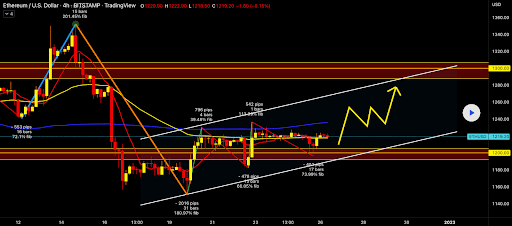
The ETH/USD 4HR chart by Financebroker is the second chart we’re examining for this Tuesday. ETH’s price is trading just above the $1,200 level, at the time of writing.
Over the Christmas holiday bearish traders tried numerous times to break bullish support at the $1,200 level but failed to get a daily candle confirmation close below that level.
Bullish Ether market participants have successfully defended that level and closed above the $1,200 level since failing to do so on December 19th.
Ether’s Moving Averages: 5-Day [$1,216.19], 20-Day [$1,249.56], 50-Day [$1,303.08], 100-Day [$1,416.49], 200-Day [$1,744.63], Year to Date [$1,997.01].
ETH’s 24 hour price range is $1,211.67-$1,233.73 and its 7 day price range is 1,211.67-$1,233.73. Ether’s 52 week price range is $883.62-$4,125.11.
The price of ETH on this date in 2021 was $4,036.24.
The average price of ETH for the last 30 days is $1,237.43 and its +0.91% over the same span.
Ether’s price [+0.74%] closed its daily candle on Monday worth $1,227.62 and in green digits for the fourth time over the last five daily candles.
Cardano Analysis
Cardano’s price was the top performer of the cryptocurrencies covered today and wrapped up Monday’s session +$0.0062.
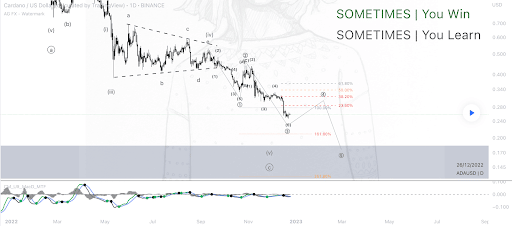
The ADA/USD 1D chart via Mr16K is where we’ll wrap up our price analyses this Tuesday. At the time of writing, ADA’s price is trading between the 161.80% fibonacci level [$0.208] and the 23.60% fib level [$0.285].
ADA’s price is +4.98% over the last 7 days and if bullish traders hope to continue that trend they need to regain the 23.60% fib level. The targets after that level are 38.20% [$0.313], 50.00% [$0.337], and 61.80% [0.363].
The bearish perspective looks much different, they’re looking to negate the recent rally and push ADA’s price below the 161.80% fib level. The secondary target for bears of ADA’s market is the 261.80% fib level [$0.132].
Cardano’s price on this date last year was $1.51.
The average price of ADA over the last 30 days is $0.294 and its -16.5% for the same stretch.
Cardano’s price [+2.39%] closed its daily session on Monday worth $0.265 and in green figures for the first time in three days.


