Bitcoin Analysis
During Wednesday’s daily trading session Bitcoin’s price declined less than 1% and when the day concluded, BTC’s price was -$166.
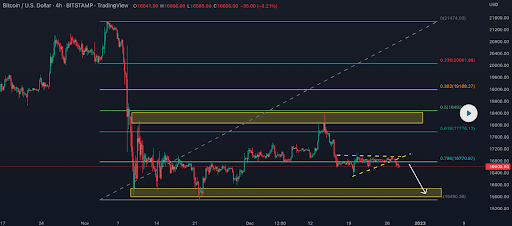
The BTC/USD 4HR chart by Obringer is the first chart of emphasis for this Thursday. BTC’s price is trading between the 0.786 fibonacci level [$16,770.87] and the 0.618 fib level [$17,776.12], at the time of writing.
Bullish traders have overhead targets on Bitcoin of 0.618, 0.5 [$18,482.20], 0.382 [$19,188.27], 0.236 [$20,061.88], and a full retracement at 0 [$21,474.03].
The pursuit of further downside by bearish traders continues as there’s been a tug of war between the $16k-$17k level for the last few weeks on BTC’s price. The primary downside target for bearish traders is BTC’s multi-year low on the BITSTAMP chart at 1 [$15,490.36].


Bitcoin’s Moving Averages: 5-Day [$16,746.93], 20-Day [$17,016.51], 50-Day [$17,766.69], 100-Day [$19,114.39], 200-Day [$24,714.01], Year to Date [$28,290.90].
BTC’s 24 hour price range is $16,444-$16,797. Bitcoin’s 52 week price range is $15,505-$48,538.
The price of Bitcoin on this date last year was $46,471.1.
The average price of BTC for the last 30 days is $16,930.4 and its +1.2% over the same stretch.
Bitcoin’s price [-0.99%] closed its daily candle worth $16,553 and in negative figures on Wednesday for a second consecutive day.
Summary
Ethereum Analysis
Ether’s price also took a step backward yesterday and finished its daily candle -$21.62.
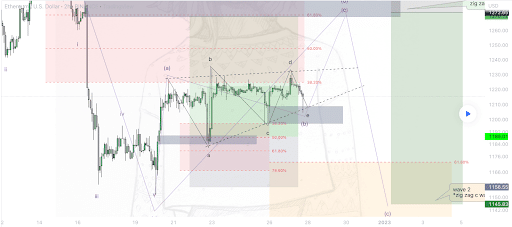
The ETH/USD 2HR chart via Mr16K is the second chart we’re looking at today. At the time of writing, Ether’s price is trading between the 50.00% fibonacci level [$1,188.44] and the 38.20% fib level [$1,197.55].
Bullish Ethereum market participants need to regain the 38.20% fib level to once again trade above the bottom of the ascending channel it’s been working on since the 19th of this month.
Conversely, bearish traders that are still shorting ETH’s price have a primary aim of the 50.00% fib level followed by targets of 61.80% [$1,179.63] and the 78.60% fib level [$1,167.09].

ETH’s 24 hour price range is $1,181.06-$1,215.78 and its 7 day price range is $1,181.06-$1,227. Ether’s 52 week price range is $883.62-$3,888.86.
The price of ETH on this date in 2021 was $3,627.17.
The average price of ETH for the last 30 days is $1,237.94 and its -0.84% for the same period.
Ether’s price [-1.78%] closed its daily session on Wednesday worth $1,189.93 and also in red figures for a second day in a row.
Polkadot Analysis
Polkadot’s price followed the macro cryptocurrency market trend on Wednesday and also traded lower at the session’s close than at the day’s open. DOT’s price closed Wednesday’s trading session -$0.192.
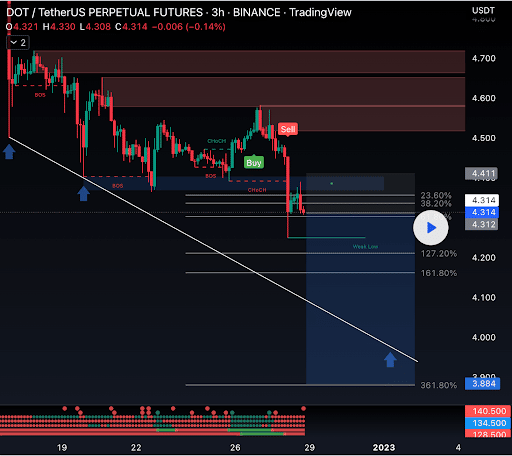
The DOT/USD 3HR chart below from SmithTradeSmart is where we’re ending our price analyses for this Thursday. At the time of writing, DOT’s price is trading between the 127.20% fib level [$4.21] and the 61.80% fib level [$4.30].
The overhead targets for bulls of the Polkadot market are 61.80%, 38.20% [$4.33], and the 23.60% fib level [$4.35].
The levels that will lead to further bearish control are 127.20%, 161.80% [$4.16] and 361.80% [$3.88].

Polkadot’s price on this date last year was $26.80.
The average price of DOT over the last 30 days is $5.16 and its -19.17% over the same timespan.
Polkadot’s price [-4.29%] painted a red daily candle on Wednesday and was worth $4.28 when traders settled-up. DOT’s also finished the last two daily trading sessions in red figures.


