Bitcoin Analysis
Bitcoin’s price made its lowest daily candle close since January 13th on Wednesday and when the day’s candle was printed, BTC was -$466.80.
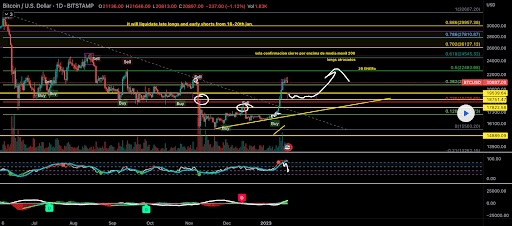
The BTC/USD 1D chart by COINS_MONSTER is where we’re kicking-off our price analyses for this Thursday. BTC’s price is trading between the 0.382 fibonacci level [$20,595.20] and the 0.5 fib level [$22,483.68], at the time of writing.
Bitcoin’s price suffered a small pullback during Wednesday’s trading session but bullish traders managed to hold support at the 0.382 fib level. Their targets to the upside if they can again send BTC’s price higher are 0.5, 0.618 [$24,545.32], 0.702 [$26,127.12], 0.786 [$27,810.87], 0.886 [$29,957.38], and the 1 fib level [$32,607.20].
Bearish traders may have won the battle during Wednesday’s trading session but in the larger picture they failed to push BTC’s price below the asset’s most critical level of inflection [$19,891] on Wednesday. The targets for bearish traders are 0.382, 0.236 [$18,476.68], 0.126 [$17,025.73], 0 [$15,503.20], and the -0.21 fib level [$13,262.15].
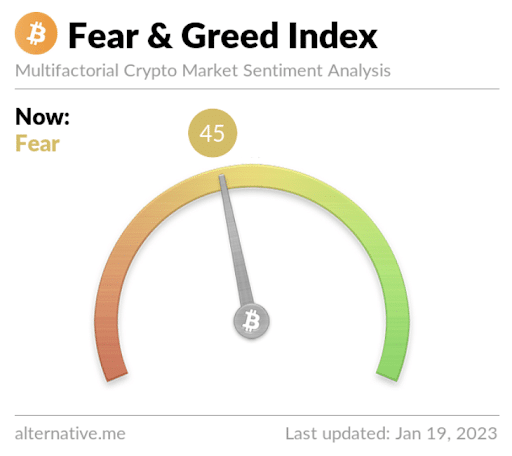
Bitcoin’s Moving Averages: 5-Day [$20,505.11], 20-Day [$17,775.43], 50-Day [$17,190.04], 100-Day [$18,479.70], 200-Day [$22,736.59], Year to Date [$18,363.85].
BTC’s 24 hour price range is $20,408-$21,639 and its 7 day price range is $17,496-$21,647.5. Bitcoin’s 52 week price range is $15,505-$48,162.9.
The price of Bitcoin on this date last year was $41,681.2.
The average price of BTC for the last 30 days is $17,649.4 and its +28.4% for the same period.
Bitcoin’s price [-2.21%] closed its daily candle worth $20,670 and in red figures for the third time over the last four days on Wednesday.
Summary
Ethereum Analysis
On Wednesday Ether’s price also marked-down during its daily trading session and concluded the day -$53.39.
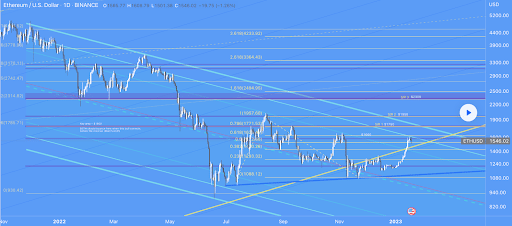
The ETH/USD 1D chart below from arjunRGB is the Ether chart of emphasis today. At the time of writing, Ether’s price is trading between the 0.5 fib level [$1,522.86] and the 0.618 fibonacci level [$1,625.46].
Bullish Ether market participants want to exceed the 0.618 fib level which is a critical level in the interim. If they succeed, their targets on ETH are 0.618, 0.786 [$1,771.53], 1 [$1,957.60], 1.618 [$2,494.95], and the 2.618 fib level [$3,364.43].
Conversely, traders that are shorting the Ethereum market have a primary aim of pushing ETH’s price again below the 0.5 fib level with consecutive closes below that level. The secondary target for bears is the 0.382 [$1,410.26], 0.236 [$1,293.32], and a full retracement at 0 [$1,088.12].
ETH’s 24 hour price range is $1,501.39-$1,610 and its 7 day price range is $1,389.84-$1,610. Ether’s 52 week price range is $883.62-$3,579.96.
The price of ETH on this date in 2022 was $3,084.20.
The average price of ETH for the last 30 days is $1,295.97 and its +35.55% for the same interval.
Ether’s price [-3.41%] closed its daily session on Wednesday worth $1,511.24. It was the second day in a row in red figures for ETH after rattling off nine consecutive green days before this trend began.
Shiba Inu Analysis
Shiba Inu’s price was the outlier of the group today and marked-up while the majority of coins across the crypto market sold-off. When SHIB’s daily candle was printed the asset was +$0.00000062.
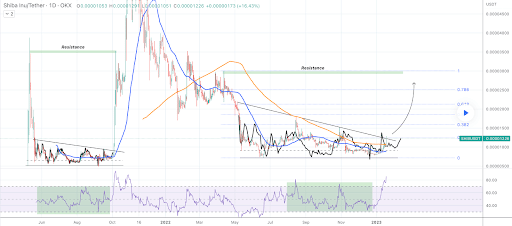
The last chart we’re analyzing for this Thursday is the SHIB/USD 1D chart by TradingShot. SHIB’s price is trading between the 0.236 fib level [$0.00001252] and the 0.382 fib level [$0.00001592], at the time of writing.
The overhead targets for bulls of Shiba Inu are 0.382, 0.5 [$0.00001858], and 0.618 [$0.00002133], 0.786 [$0.00002518], and the 1 fib level [$0.00003004].
Contrariwise, bearish SHIB traders are aiming for 0.236 firstly with a full retracement at the 0 fibonacci level [$0.00000720] as their secondary aim.
Shiba Inu’s 24 hour price range is $0.00001068-0.00001294. SHIB’s 52 week price range is $0.00000913-$$0.00001270022.
Shiba Inu’s price on this date last year was $0.00002727.
The average price of Shiba Inu over the last 30 days is $0.00000881 and its +40% over the same duration.
Shiba Inu’s price [+5.88%] closed its daily candle on Wednesday worth $0.00001117 and in green figures for the ninth time over the last eleven days.


