

Bitcoin Analysis
Bitcoin’s price started the new week in green figures on Monday and when traders wrapped-up and the day’s candle was printed, BTC was +$208.5.
The BTC/USD 1D chart below by firmestudio is the first chart we’re analyzing for this Tuesday and posits that bulls could be in for some short-term turbulance. BTC’s price is trading between the 78.60% fibonacci level [$17,751.17] and the 70.70% fib level [$23,262.54], at the time of writing.
The chartist alludes to the fact that BTC’s bumping up against “the mother of all trendlines from ATH.” If bullish traders can exceed the 70.70% fib level with candle close confirmation their targets are 50.00% [$36,055.81], and a full retracement at 0.00% [$68,608.55].
Bearish traders are looking to confirm that this recent rally on BTC is indeed a bull trap and they’re still in control of the Bitcoin market. The targets to the downside of the daily time frame for bearish traders are 78.60%, 88.60% [$11,241.14], and the 100.00% fibonacci level [$3,850.00].
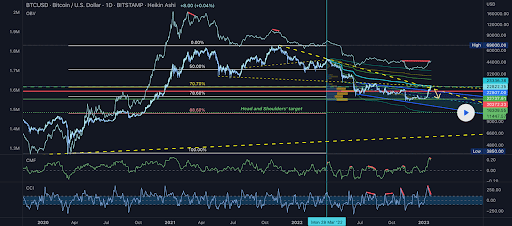
Bitcoin’s Moving Averages: 5-Day [$21,631.65], 20-Day [$18,526.89], 50-Day [$17,492.44], 100-Day [$18,531.48], 200-Day [$22,455.79], Year to Date [$19,009.48].
BTC’s 24 hour price range is $22,500-$23,180 and its 7 day price range is $20,670-$23,180. Bitcoin’s 52 week price range is $15,505-$48,162.9.
The price of Bitcoin on this date last year was $36,683.
The average price of BTC for the last 30 days is $18,489.7 and its +35.9% over the same interval.
Bitcoin’s price [+0.92%] closed its daily candle worth $22,916 on Monday and in positive figures for the fourth time over the last five days.
Summary
Ethereum Analysis
Ether’s price started off the week’s initial daily candle -$0.48 and ETH is +33.06% for the last 30 days.
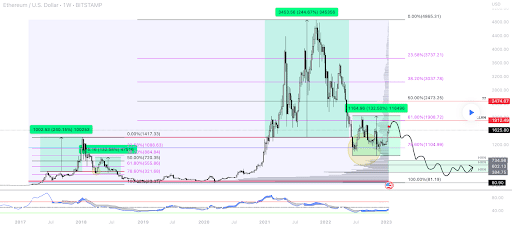
The ETH/USD 1W chart from rivaldealer is the second chart on our list for this Tuesday. At the time of writing, Ether’s price is trading between the 78.60% fib level [$1,104.99] and the 61.80% fib level [$1,908.72].
If bulls can regain the 61.80% fib level and then the $2k level their next fib target is 50.00% [$2,473.25]. Above that level the targets to the upside on ETH are 38.20% [$3,037.78], 23.58% [$3,737.21], and 0.00% [$4,865.31].
Naturally, those still shorting ETH have another agenda and that entails rejecting bulls at the 61.80% fib level and reversing Ether’s price action back to the downside. The targets for bears are 78.60%, and the 100.00% fibonacci level [$81.19].
ETH’s 24 hour price range is $1,585.29-$1,648.09 and its 7 day price range is $1,511.24-$1,648.09. Ether’s 52 week price range is $883.62-$3,579.96.
The price of ETH on this date in 2022 was $2,440.81.
The average price of ETH for the last 30 days is $1,357.57 and its +32.47% over the same duration.
Ether’s price [-0.03%] closed its daily session on Monday worth $1,626.53 and in red digits for the second time over the last three daily candles.
Axie Infinity Analysis
Axie Infinity’s price was the worst performer of the lot covered today and when AXS printed its daily candle it was -$0.38.
The AXS/USD 1D chart below from MonoCoinSignal is the chart that we’re wrapping up with today. Axie Infinity’s price is trading between the 161.80% fibonacci level [$11.79] and the 261.80% fib level [$14.31], at the time of writing.
The targets for bulls of AXS after the 261.80% fib level are the 361.80% [$16.83] and the 423.60% fib level [$18.39].
Bearish AXS traders are conversely pushing to send the asset’s price below the 161.80% fibonacci level. They’ve a secondary target of the 100.00% fib level [$10.23] followed by 78.60% [$9.69], 61.80% [$9.27], and 50.00% fibonacci level [$8.97].

Axie Infinity’s 24 hour price range is $11.42-$13.94 and its 7 day price range is $8.03-$13.94. Axie Infinity’s 52 week price range is $5.76-$75.39.
Axie Infinity’s price on this date last year was $51.21.
The average price of AXS over the last 30 days is $7.72 and its +82.16% for the same period.
Axie Infinity’s price [-3.02%] closed Tuesday’s daily candle worth $12.22 and in negative figures for the second time in three daily sessions.