


Blockchain analytics firm Chainalysis has released a report explaining the importance of on-chain analysis when it comes to studying in detail the health of a cryptocurrency.
Unlike traditional asset classes, crypto tokens are relying on a decentralized ledger on which it is possible to observe all the steps taken in their lives by studying the mechanisms that lead to rising or falling prices.
According to Chainalysis, there are 3 factors in particular to observe in this context: distribution, liquidity, and market composition.
The report explains the role of each of these factors by analyzing certain metrics for 4 distinct cryptocurrencies, namely BTC, ETH, USDC, and FTT.
Summary
The distribution factor according to Chainalysis
In Chainalysis’ report, the first factor to be mentioned is the distribution factor: to understand how well distributed a token is within the market, it is essential to take a look at the “total number of wallets” metric.
This figure tells us how popular a cryptocurrency is and how many wallets have held even a fraction of the cryptocurrency over time.
Wallets, unlike simple addresses, give a more accurate view of the number of “unique holders.”

ETH is the cryptocurrency with the most wallets among the 4 considered with a number of 79 million units, followed of course by BTC with 50.2 million units.
Probably the presence of Ether in the DeFi domain has seen a more widespread use case for the cryptocurrency which has found more popularity than Bitcoin, which doesn’t support smart contracts and therefore cannot be part of the decentralized finance world.
USDC and FTT, launched more recently than the first two, reflect more modest numbers, with the stablecoin nonetheless seeing a wallet count of 1.5 million while the FTT exchange token settles at 52.6 thousand, with little room for growth.
However, this type of observation, which is based solely on the number of wallets holding a cryptocurrency, is not comprehensive and representative of how supply is concentrated around a given number of wallets.
Indeed, it is very important to include with the previous metric the metric of “number of wallets holding 50% of the supply,” which gives us an understanding of how much a crypto is actually distributed among investors.

In the case of BTC, about 4,500 wallets, or 0.009% of all existing Bitcoin wallets, hold 50% of the coin’s supply, making it the most decentralized coin compared to the others considered. USDC has 196 wallets among the top holders, ETH sees 131 while for FTT only 1 wallet holds more than 50% of the supply.
It is very important to understand how the concentration of this metric varies over time to see if a currency tends for decentralization or centralization around a few individuals.
For instance, between November 2022 and January 2023, Bitcoin saw a rapid contraction in supply concentration by seeing the number of wallets go from 3,331 to 4,172. Throughout 2022, USDC followed this distribution trend.
On-chain analysis of a token: the concept of liquidity according to Chainalysis
Another dimension of analysis mentioned by Chainalysis is that of liquidity.
Let’s say that for a cryptocurrency to be easily tradable in the markets with the ability to execute large buy or sell orders without creating a significant impact on its price is a key aspect.
When a cryptocurrency enjoys high liquidity, it means that exchanges are facilitated on different facts of the markets, with little chance of price manipulation and deceptive practices. In addition, a growth in liquidity over time is a positive for the cryptocurrency as it means that investors’ interest in it is also growing.
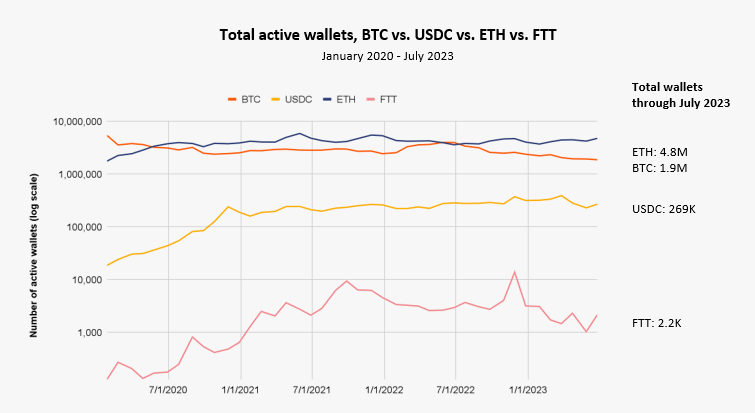
In order to assess this important factor, we need to take a look at the “number of monthly active wallets” metric. A wallet is considered active over a month if it executes at least one transaction for the asset in question.
ETH leads the way with 4.8 million active wallets as of July 2023, having seen strong growth during the DeFi industry’s explosion phase in the summer of 2020.
BTC and USDC are also doing well, although digital gold is seeing slightly declining numbers in recent months while still maintaining a good base of active wallets.
FTT, on the other hand, seems to have gone into freefall since the FTX exchange declared Chapter-11 bankruptcy, ushering in an era of disinterest in the coin.
The market composition factor
As for the “market composition” factor, it is worth noting the importance of analyzing the type of entities holding a cryptocurrency during a given time frame.
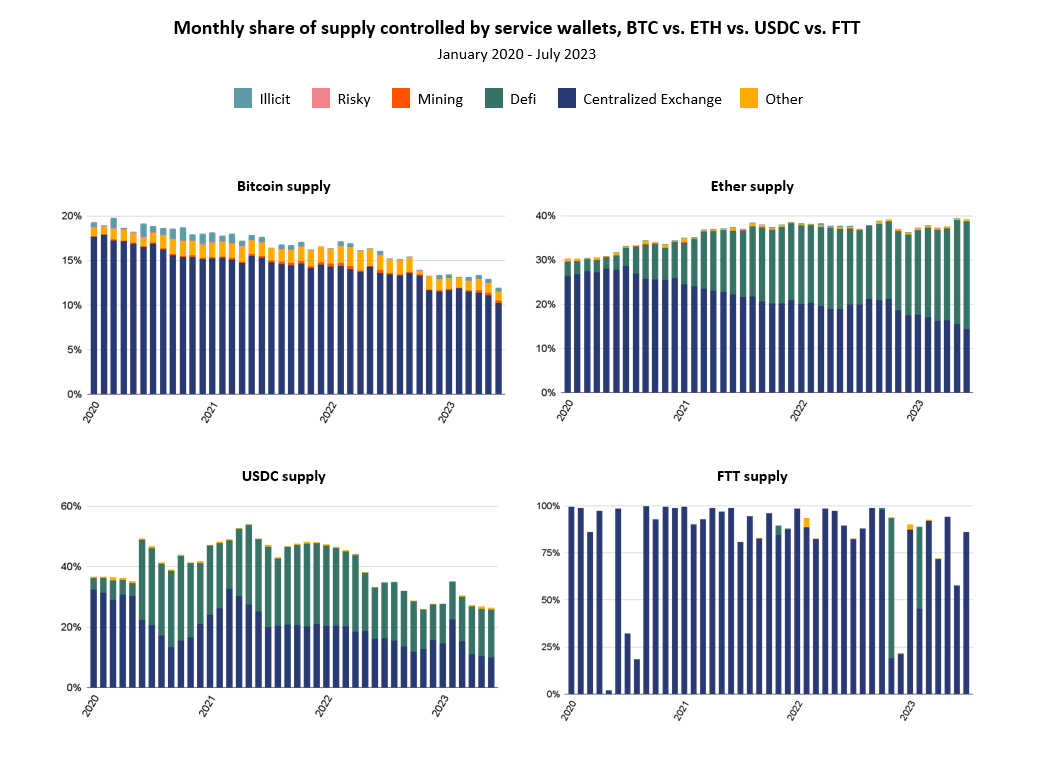
The metric of the percentage of the supply controlled monthly by “services wallets” gives us a very detailed understanding of how the overall outlook of a cryptocurrency evolves, as it shows us which entities are accumulating or selling a cryptocurrency, making the whole study significantly clearer.
In this regard, usually when a cryptocurrency is about to have a massive sell-off, it is moved to centralized exchanges where there is more liquidity for trading.
Conversely when there is accumulation going on it is moved off exchanges, where users do not possess the private keys to their wallets and have a lower security score.
As such, observing movements to and from CEXs is critical to understanding whether we are heading into a selling or buying season for a distinct cryptocurrency.
Generally for BTC and ETH, their presence is increasingly sparse within exchanges, with individual investors accumulating coins as they go.
In any case, when we see a share increase in a month on CEXs, caution should be taken given the high risk of capitulation in the market.
For ETH, it is interesting to note that the currency’s presence in the DeFi field has been steadily growing since 2020 until now.
For FTT, the presence on exchanges is dominant, creating unreassuring contexts for the potential selling pressure that may come.
For USDC, in contrast to BTC and ETH, the months in which the share on exchanges has increased is reconciled with phases of price increases throughout the crypto market

