Bitcoin has surpassed the price of $42,000 today, after a long period of 1 year and 8 months in which it was traded at a lower level.
Most of the supporters of the orange coin have entered into complete FOMO, convinced that we have officially entered a bull market.
Although the outlook for crypto assets is excellent, we must remain clear-headed and analyze the situation objectively, also highlighting hypothetical negative scenarios.
Here’s everything you need to know about Bitcoin and its price trend.
Summary
The price of Bitcoin returns above $42,000 and ignites the market: what is happening?
The price of Bitcoin has just jumped above $42,000, printing a big green candle of +4.86% on the daily chart that has excited the spirits of all crypto investors.
The decentralized currency par excellence had not reached this level since April 2022, a period in which one of the most ruthless bear markets in history began.
At the time of writing, BTC is traded at a price of 42,006 dollars, with a total market capitalization of 820 billion dollars and a trading volume in the last 24 hours of 28.9 billion dollars.
The bullish momentum today with which the $40,000 level was regained could serve as a new starting point for the next bullish market according to Ryan Lee, Chief Analyst of Bitget Research.
In addition, a new category of assets within the Bitcoin ecosystem, ORDI, has experienced a surge over the weekend, indicating a strong speculative sentiment in the market.
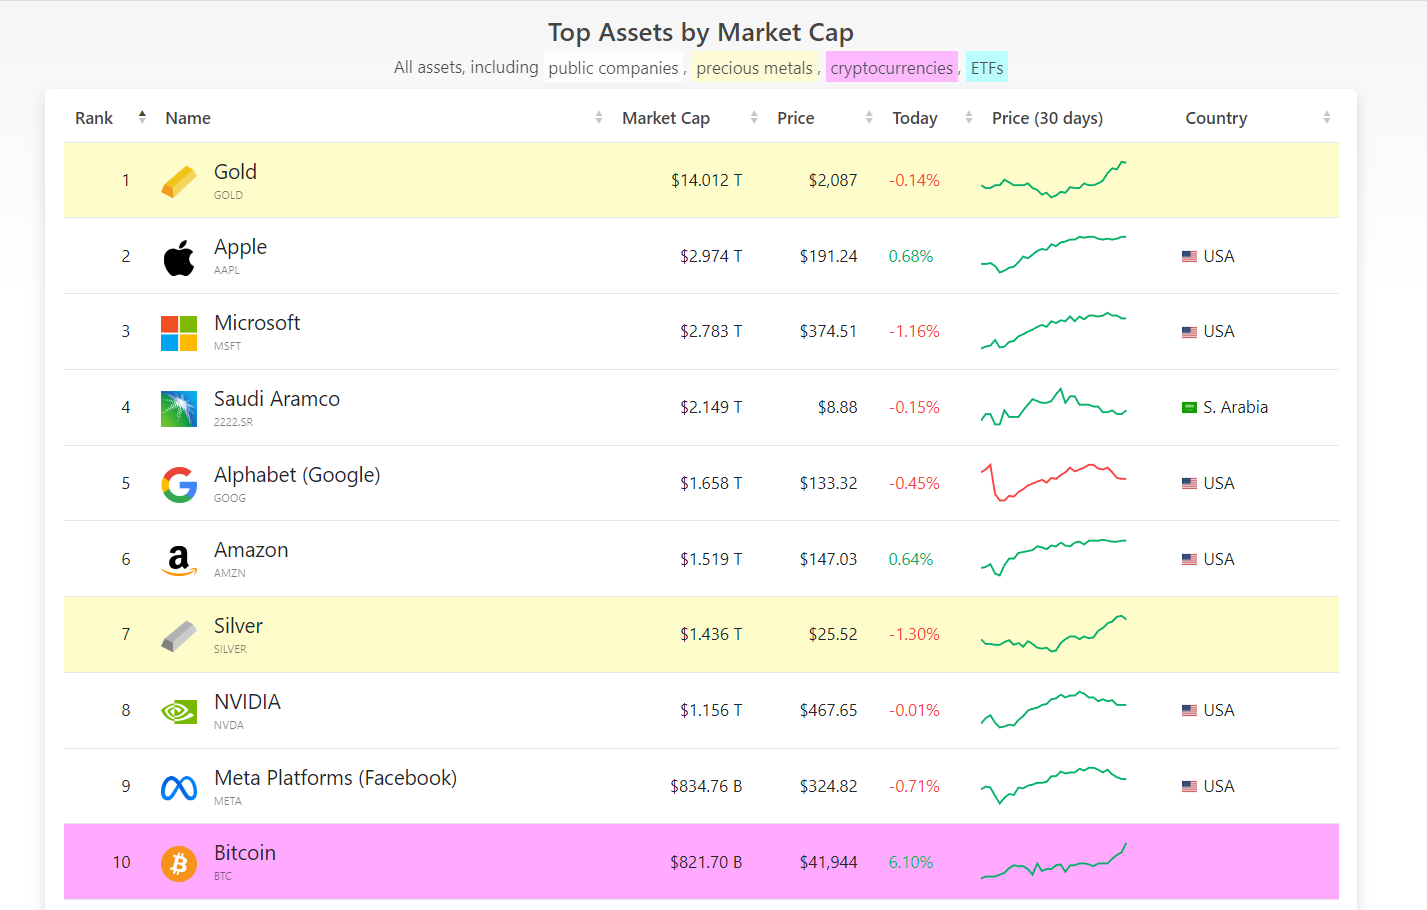
With the latest rally, the orange coin has positioned itself within the top 10 most capitalized assets in the world, behind Meta which is just 13 billion dollars away.
All those who in the past year have praised Bitcoin, defining it as a useless and worthless asset, should observe the following image and take a minute of silence to redeem their sins.
Prominent figures in the world of finance and institutions like the ECB (we sincerely congratulate Lagarde) had given the ultimatum for the end of the crypto sector, which, according to them, was supposed to implode on itself with the fall of the king.
Data in hand, however, BTC is still here, more vibrant than ever, just like the entire cryptographic industry that is benefiting from the latest price surge.
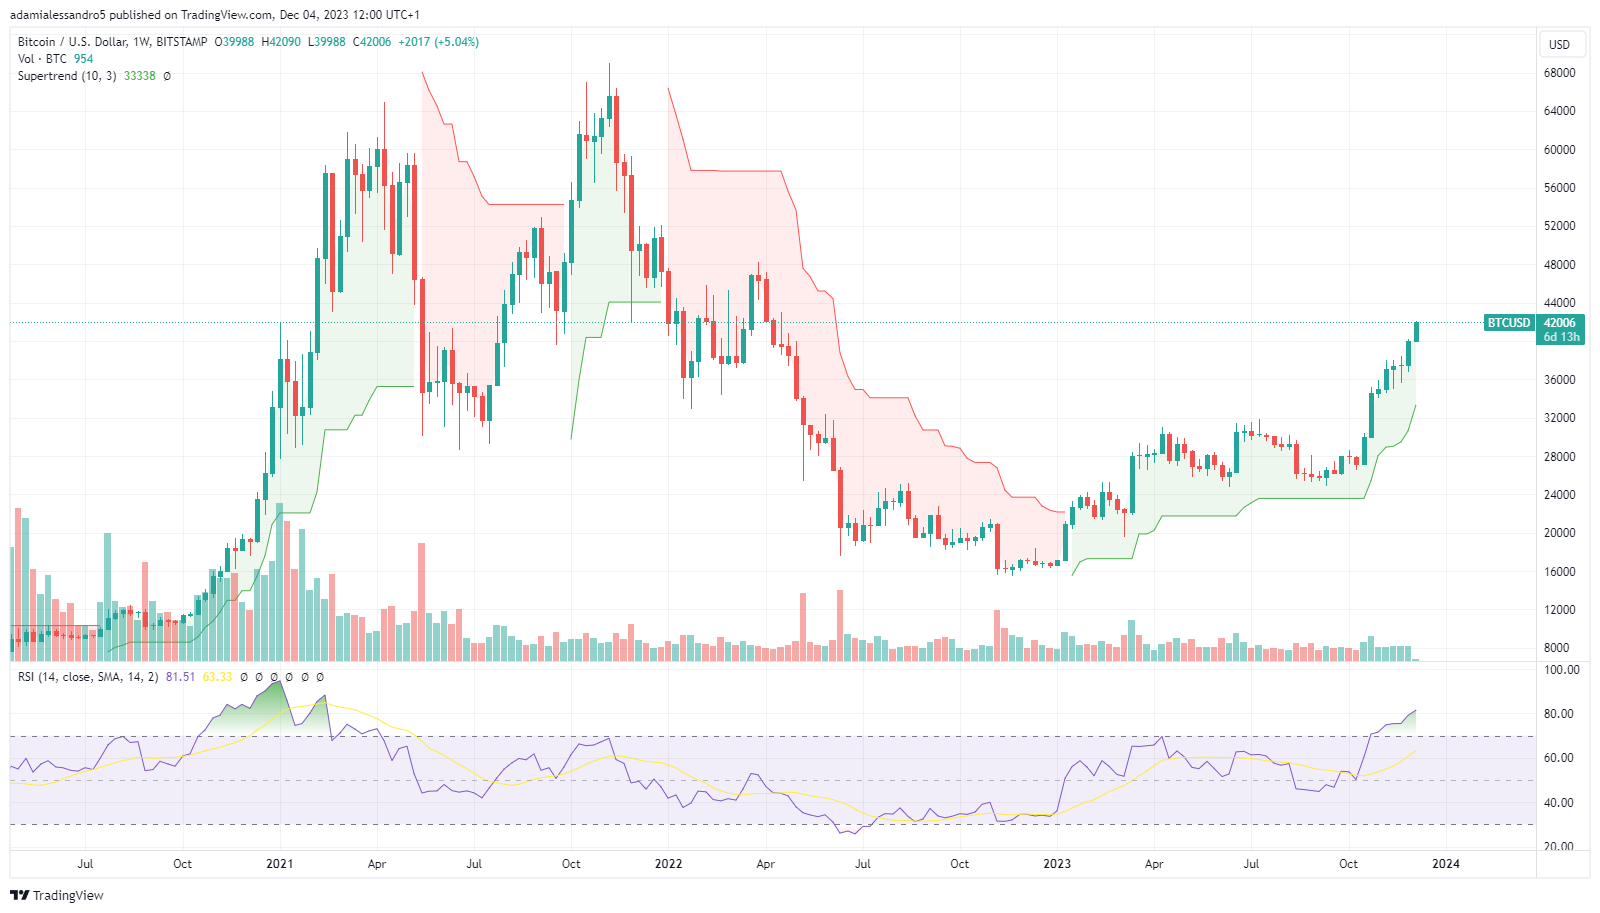
Taking a look at the weekly BTC-USD chart, we can clearly see how a dramatic situation like the one recorded in November 2022, coinciding with the crash of the FTX exchange, is now completely reversed with the bulls having the situation under control.
Counting the week that started today, we are at the eighth consecutive green candle for BTC, which has led prices to increase from $27,000 to the current values.
Although the situation appears visually positive, with an overall extremely bullish outlook, we must obligatorily report a chart that is decidedly too extended to the upside.
In fact, as indicated by the RSI indicator, we are in an overbought zone, which could trigger a retracement in the near future.
Attention, therefore, not to get carried away by too much enthusiasm without evaluating the closing of the current weekly candle: there is still the risk of a negative closing with spikes.
This obviously doesn’t change the cards on the table for the long term (more bullish than ever), but it only serves to highlight that maybe we haven’t officially reached a bull market yet.
Stay calm and keep a cool head, trader.
Analysis of Open Interest (OI) and liquidations in the derivatives market: focus on these two metrics
In order to provide a more comprehensive overview of the situation, we cannot solely observe the price of Bitcoin, but we must compare it to the data of the derivative markets.
The funding rate on any trading platform is significantly positive: every 8 hours, the longs, which dominate the market, pay the shorts with a rate higher than 0.03%
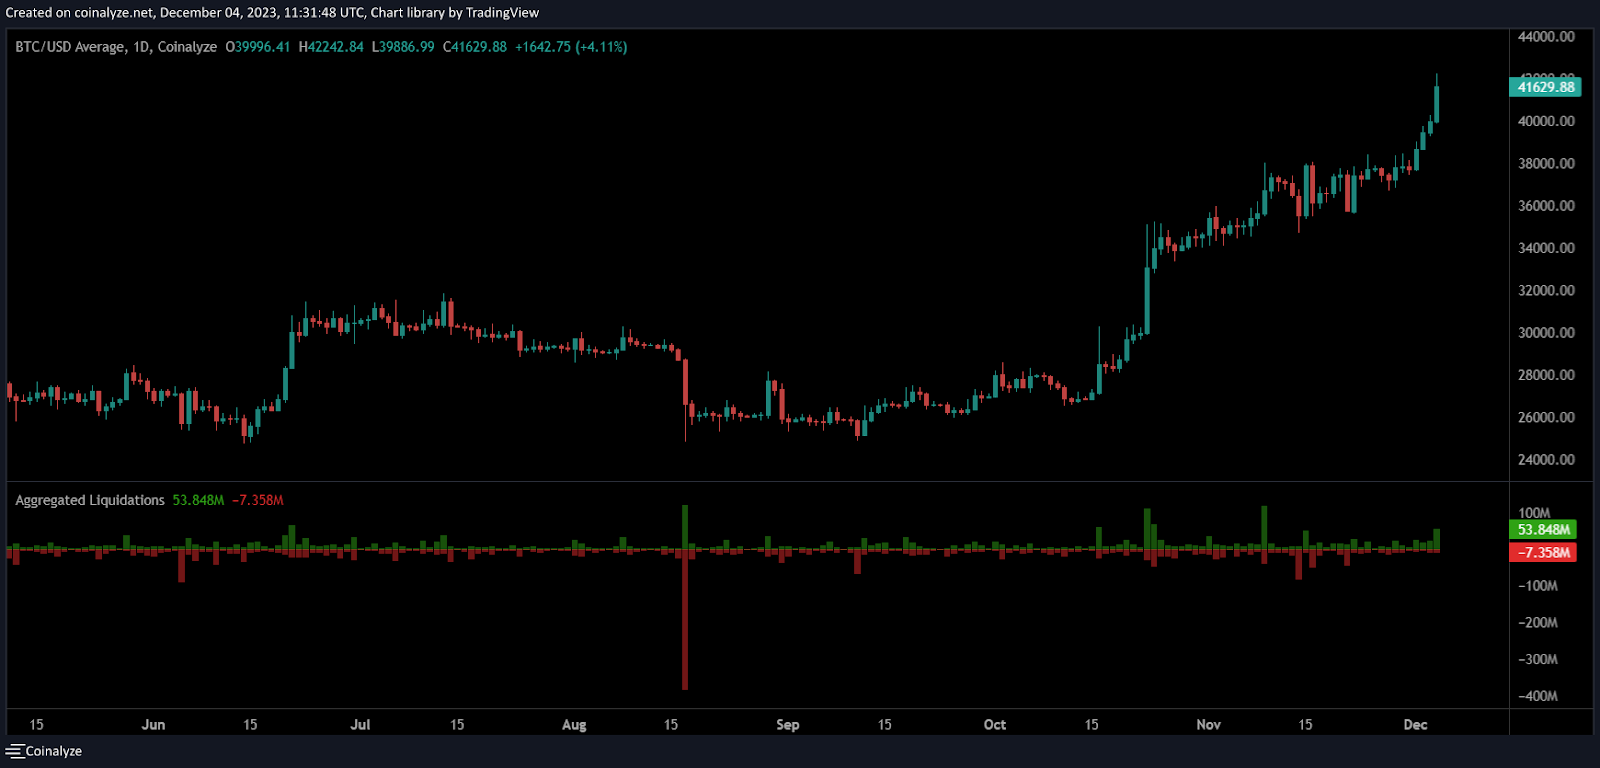
According to Coinalyze data, the aggregated open interest on Bitcoin, which sums up all the open contracts on futures and options markets, is increasing this week and has reached the key value of $12 billion, which has not been touched since March 2022.
This means that the participation of traders is growing, although it is still far from the levels recorded during the peak of the 2021 bull market.
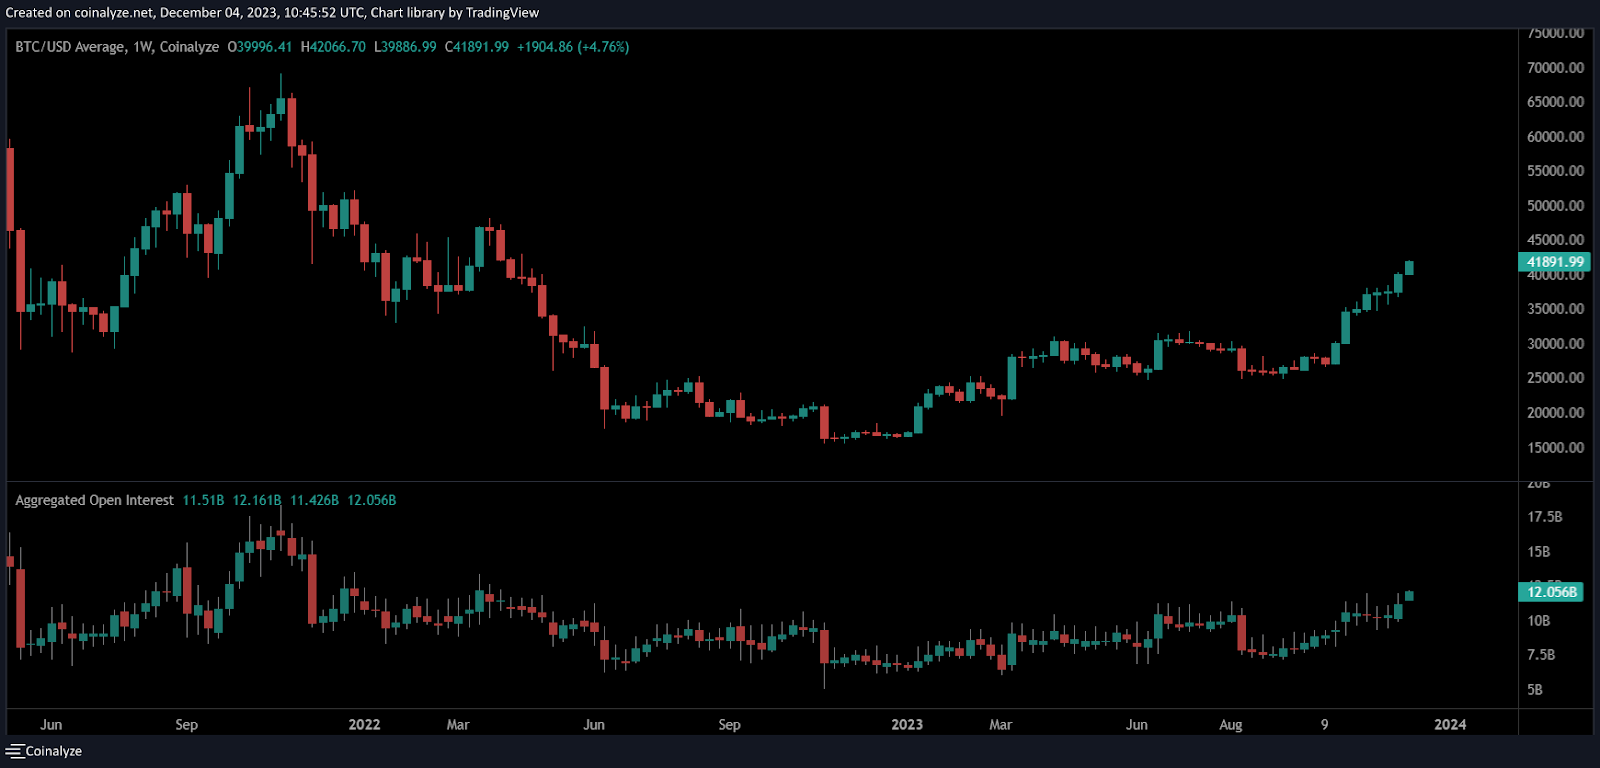
In essence, investors’ focus is gradually shifting towards business squares like the cryptographic ones, but we are still at the dawn of a new speculation frenzy.
On the other hand, the retail interest in investment products like Bitcoin is still very low compared to 2021 data.
Looking instead at the liquidations, we notice how today’s latest rally has led to the evaporation of just $52.8 million in short positions, which makes us reflect on whether the break of $40,000 was psychologically more significant.
Today’s settlements amount to about half compared to those recorded during the pump on November 9, 2023, when the price of $38,000 was reached for the first time in months.
This detail gives a less encouraging spectrum of analysis on Bitcoin’s short-term forecasts, which could take a step back in the coming days.
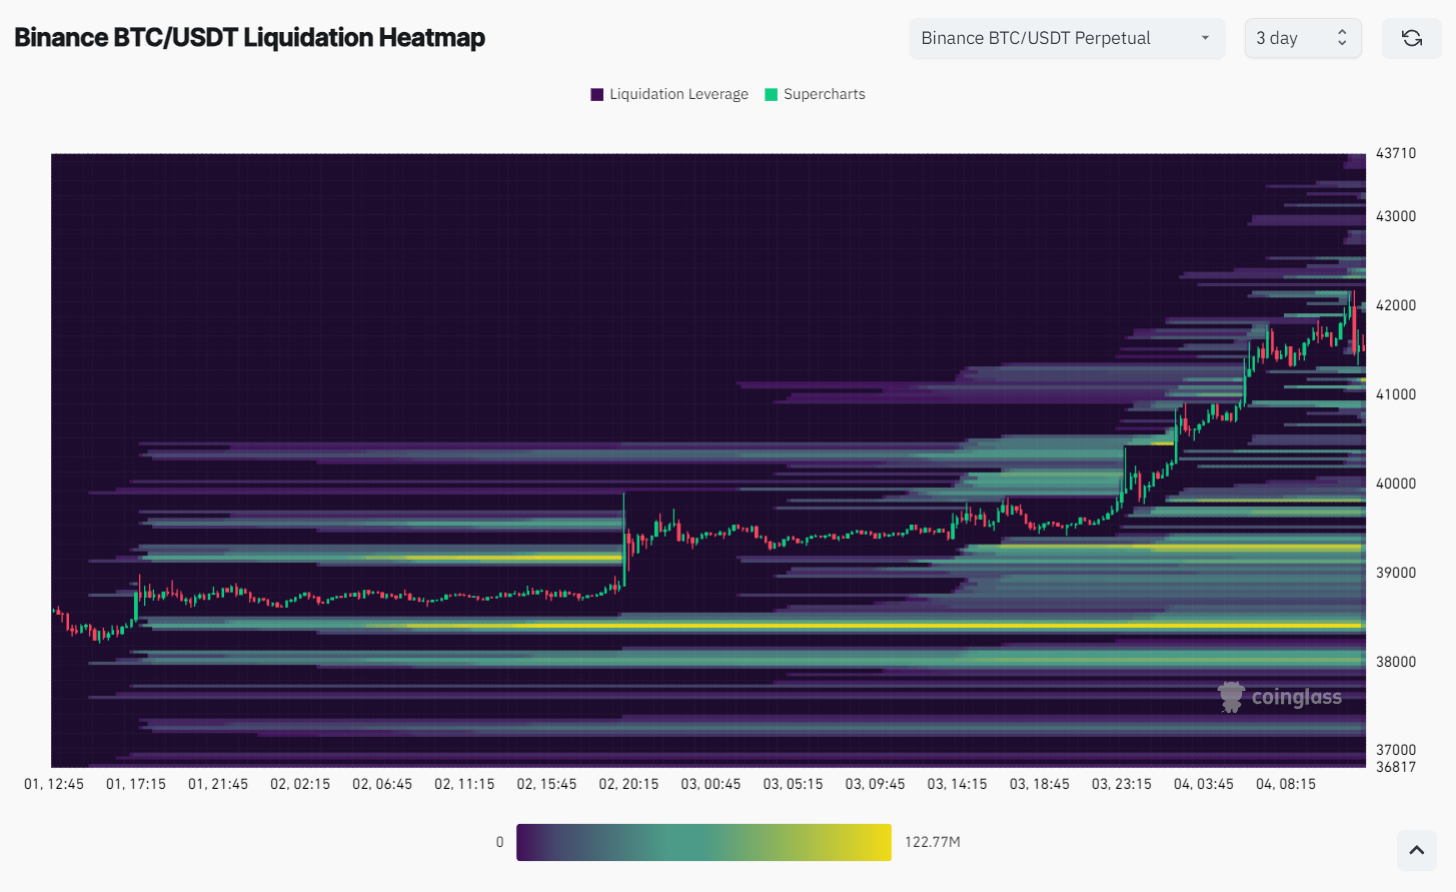
Speaking of bearish scenarios, we absolutely need to keep an eye on the levels of $39,300 and $38,300, whose break could trigger a cascade of significant sell-offs.
According to the data from Coinglass, only on these two specific levels we find 250 million dollars in open positions on Binance ready to jump.
This could give momentum for an even deeper dump, with a hypothetical target that could extend beyond $35,000.
The overall market situation: Total Marketcap and Bitcoin Dominance graph
Finally, a noteworthy analysis on Bitcoin and its price performance cannot but include a brief paragraph on the overall market situation.
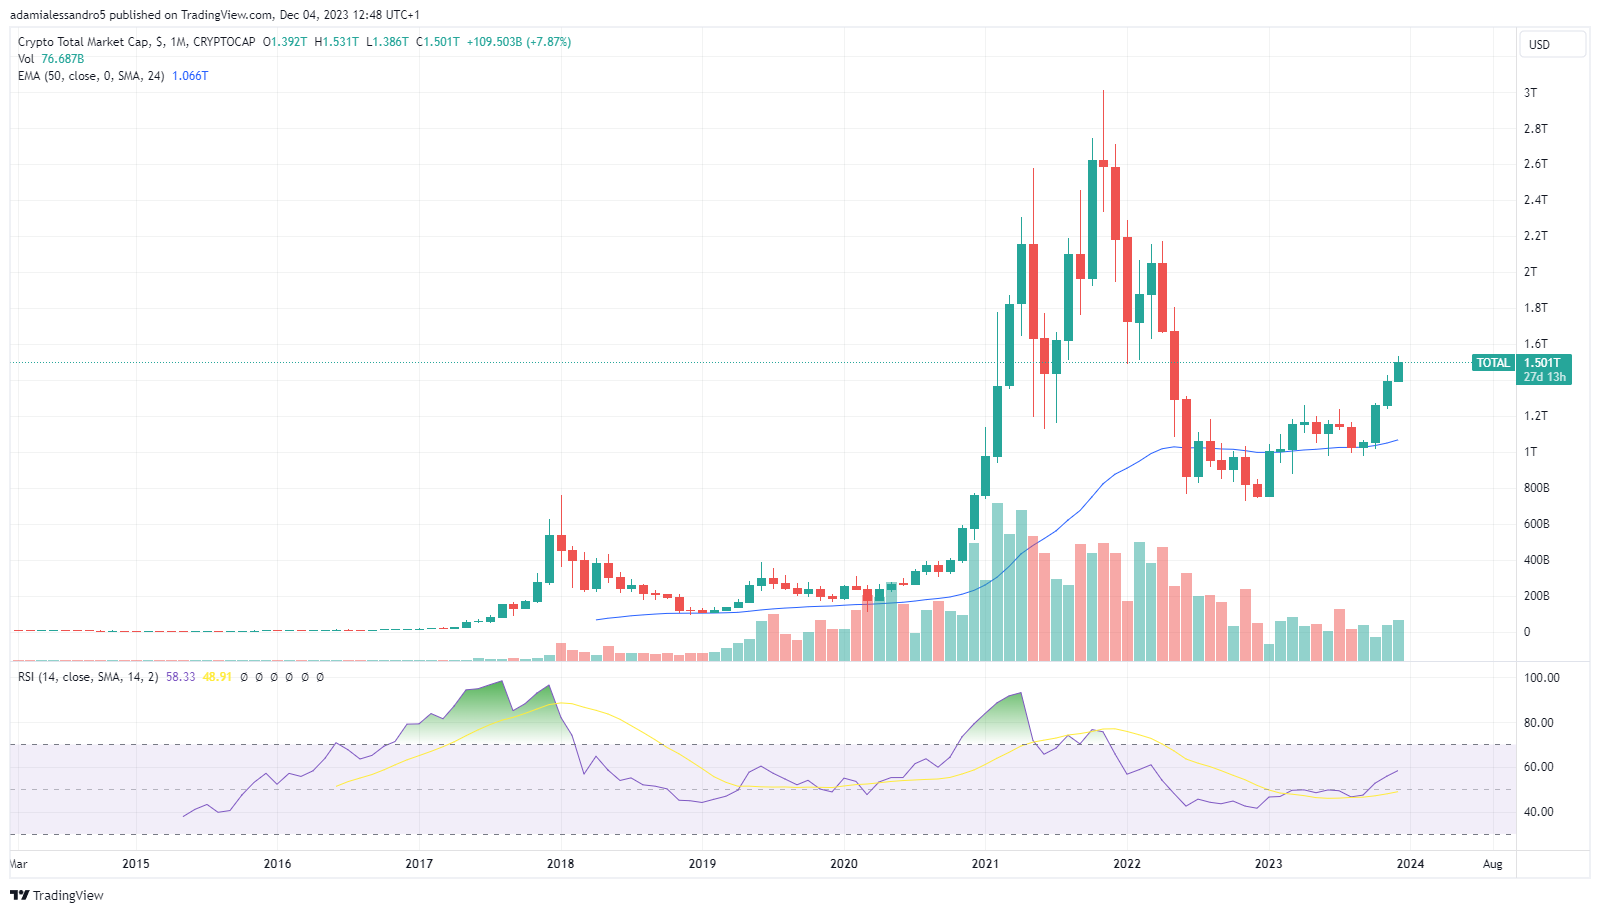
In this regard, by observing the “Total Marketcap” chart, we can see how the $1.50 trillion threshold is a dividing line that separates the hypotheses of the bulls and bears.
Closing the month of December above this value would give greater strength to Bitcoin, which will most likely consequently start the year in the best possible way.
We remind you, among other things, that between January 5th and 10th there are several deadlines for a possible approval of the Bitcoin spot ETF by the SEC.
Investors are confident that the proposals from BlackRock, Ark, Fidelity, and other asset managers will be accepted by the federal agency for the supervision of the US markets, which would provide a regulated investment vehicle for institutional investors.
If these deadlines, on the other hand, unexpectedly lead to a negative result, we could see a sharp drop in the total market cap chart, which would still remain positive if it manages to maintain the threshold of 1.2 trillion dollars.
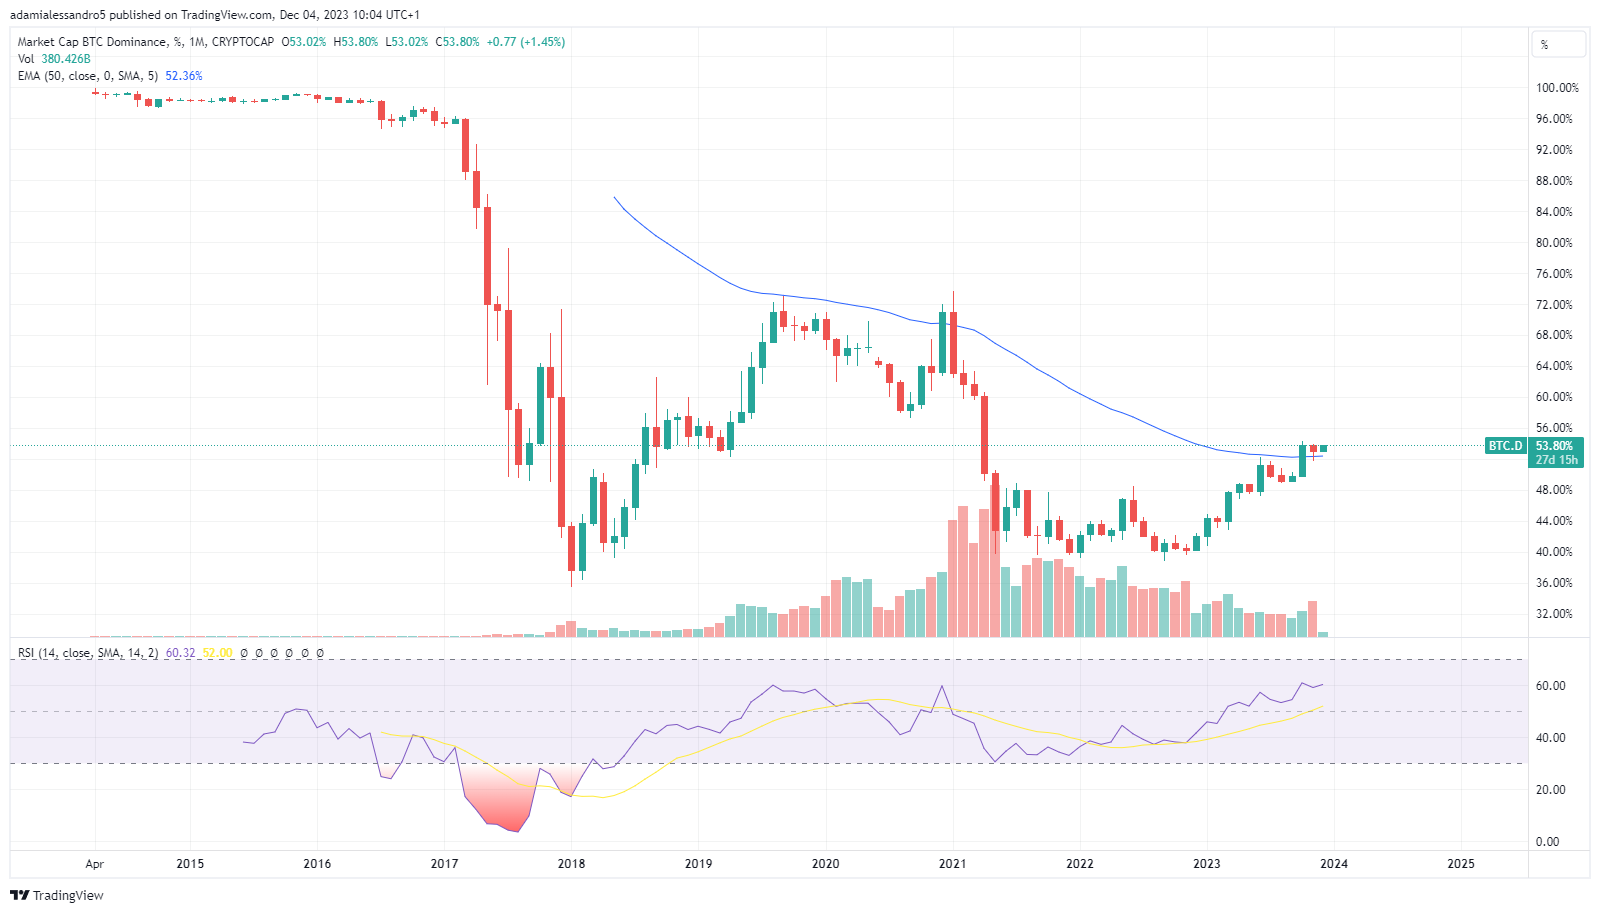
On the Bitcoin Dominance front, we can see how the price increase since the beginning of the year has been accompanied by a growth in the dominance of the market king, which recently reached a value of 50% and currently stands at 53.80%.
A trend like this gives hope for a continuation of the price increase, which could subsequently lead to the long-awaited altseason, in which degens have a lot of confidence in 2024.
What we DO NOT want to happen from here on, is a downtrend of Bitcoin Dominance followed by a dump of the Total MarketCap, which would signal a capital outflow from the crypto sector.
On the contrary, a parallel growth of these two graphs would provide greater support to the current uptrend.
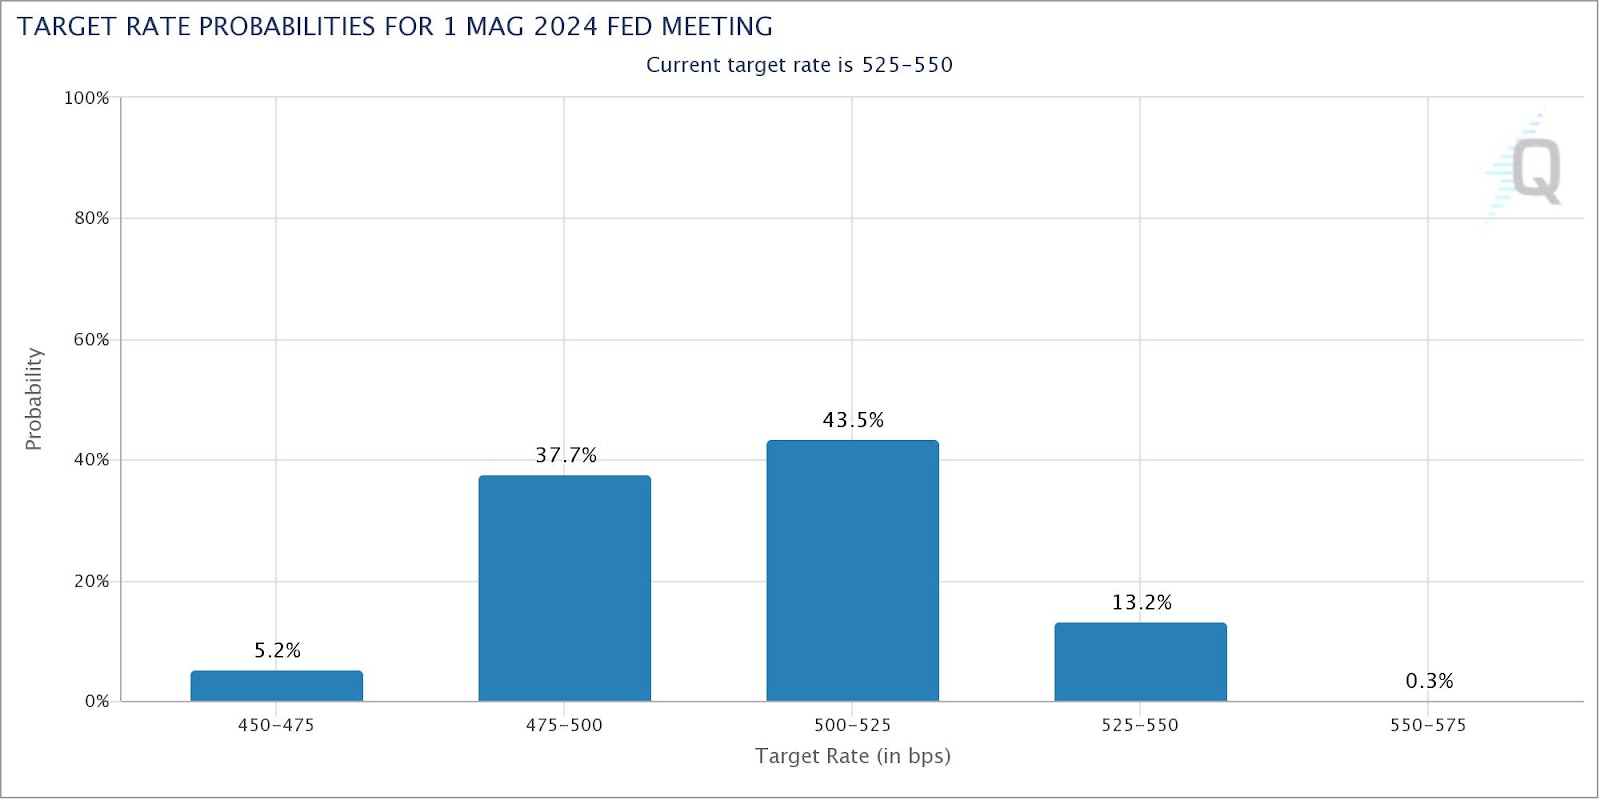
In conclusion, we cannot fail to attach what are the forecasts for the next decrease in the “Fed Funds Rate”, which outline the US monetary policy and the economic stimuli that will be poured into speculative markets such as the crypto market.
In this regard, in fact, we can observe how as early as March 2024 we could celebrate the first decrease of 500 basis points in interest rates on US government bonds after a year of tightening easing.
In May, there could be a further cut of 475 basis points, which would give even more boost to the stock market and obviously to Bitcoin.
These dynamics will most likely have the greatest impact on the price of Bitcoin, which in the best case scenario could even exceed $100,000 by 2024.
According to Ryan Lee, Chief Analyst at Bitget Research, investors may have already priced in this scenario, which is publicly visible through the FedWatch Tools.
However, trying to stay calm without falling into FOMO, we are waiting for the end of this week to update our analysis, and in a longer time frame, we are waiting for the results of the next Fed meeting.