


In this article we will evaluate the effectiveness of an intraday breakout strategy on the world’s most famous cryptocurrency, Bitcoin.
The test involved a simple breakout strategy exploiting the main characteristic of cryptocurrencies, namely volatility. The underlying idea of the system is to take advantage of the volatility explosions of Bitcoin (BTC) by verifying if, in addition to the common Buy & Hold strategy, there are other paths to follow, without the heart-pounding oscillations that generally characterize it.
Summary
Volatility breakout strategy on Bitcoin (BTC)
It has been decided to develop the strategy only on the long side due to the nature of this instrument, as well as cryptocurrencies in general, which have a strong underlying bullish bias.
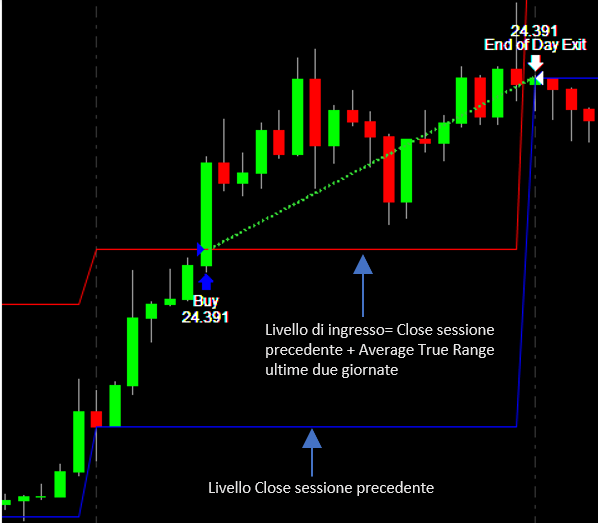
The analyzed strategy will buy at a specific level represented by the previous day’s session close, to which the value of the average true range of the last two days will be added. This will be the level that triggers purchases and will be recalculated once a day, remaining fixed throughout the session. The system will work on a chart with 60-minute bars, while the calculation of entry levels will be performed on daily bars.
The monetary value for each trade will be equal to $10,000, considering that Bitcoin (BTC) is a scalable instrument and there is no obligation to operate on a whole contract. No money management will be applied, therefore the profits from the trades will not be reinvested and the size will always remain fixed.
The trade will close at the end of the session (hence the intraday characteristic of the strategy), unless the stop loss has been triggered earlier, which in this initial test is set very wide at $1,000.
What is the average true range and what does it represent? The average true range is a famous indicator created in the 1970s by J. Welles Wilder and commonly used to measure the volatility of an instrument by exploiting the concept of “range”, which is the distance between the high and low of a bar. In this case, it is very well suited to an underlying asset like Bitcoin (BTC) which has high volatility as one of its peculiarities.
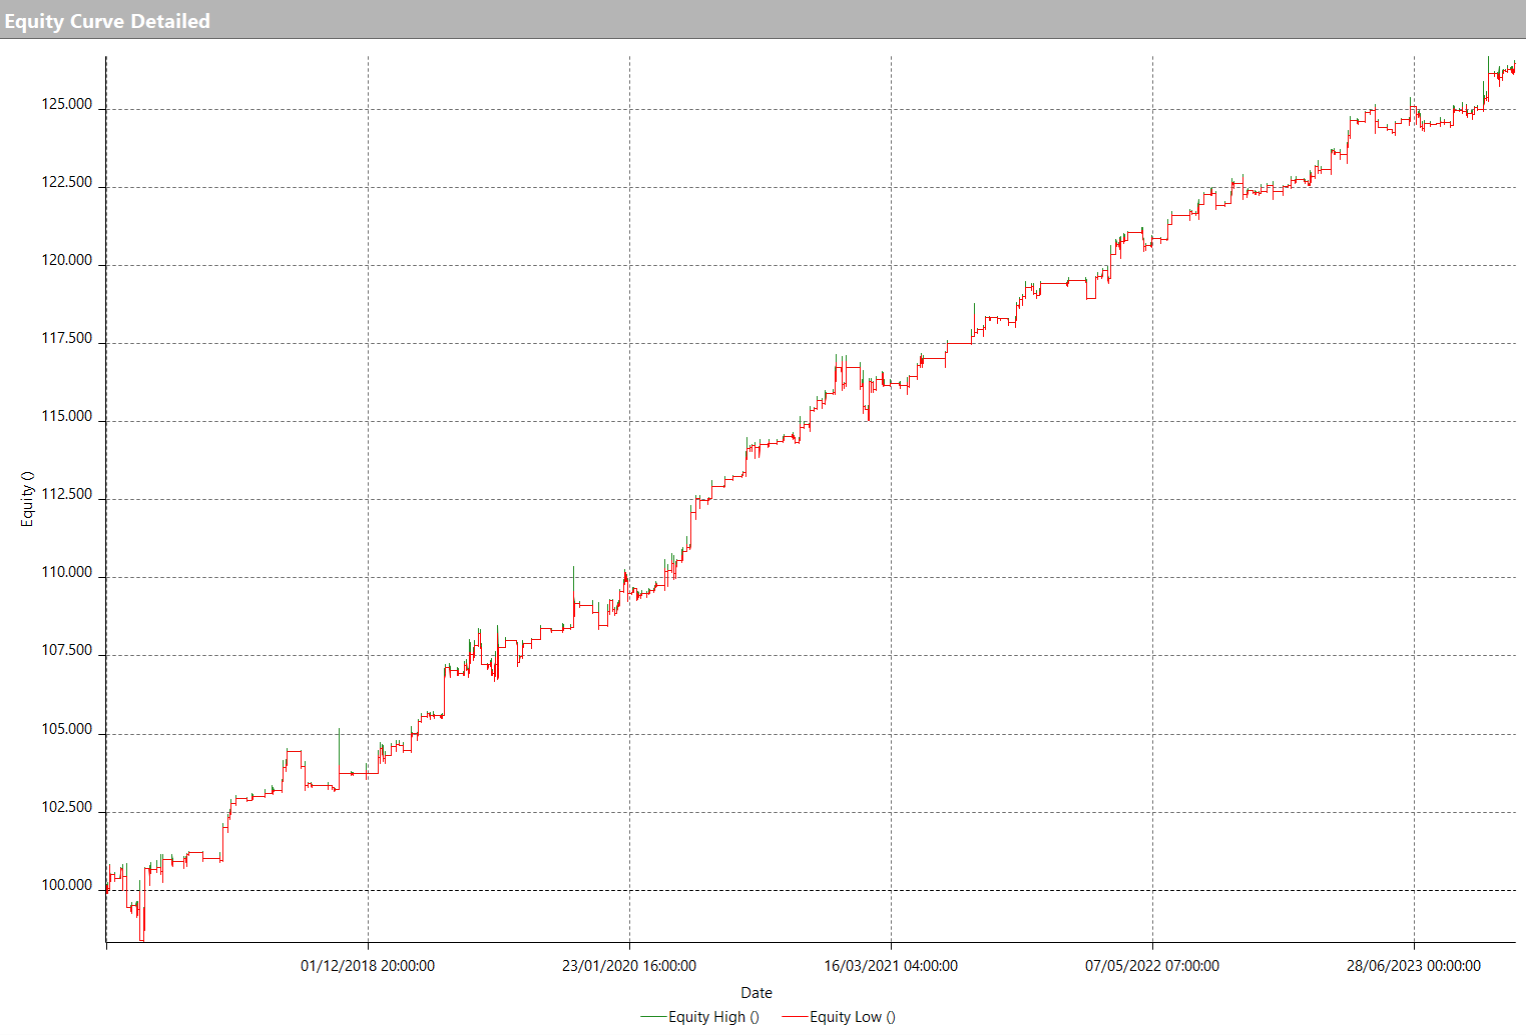
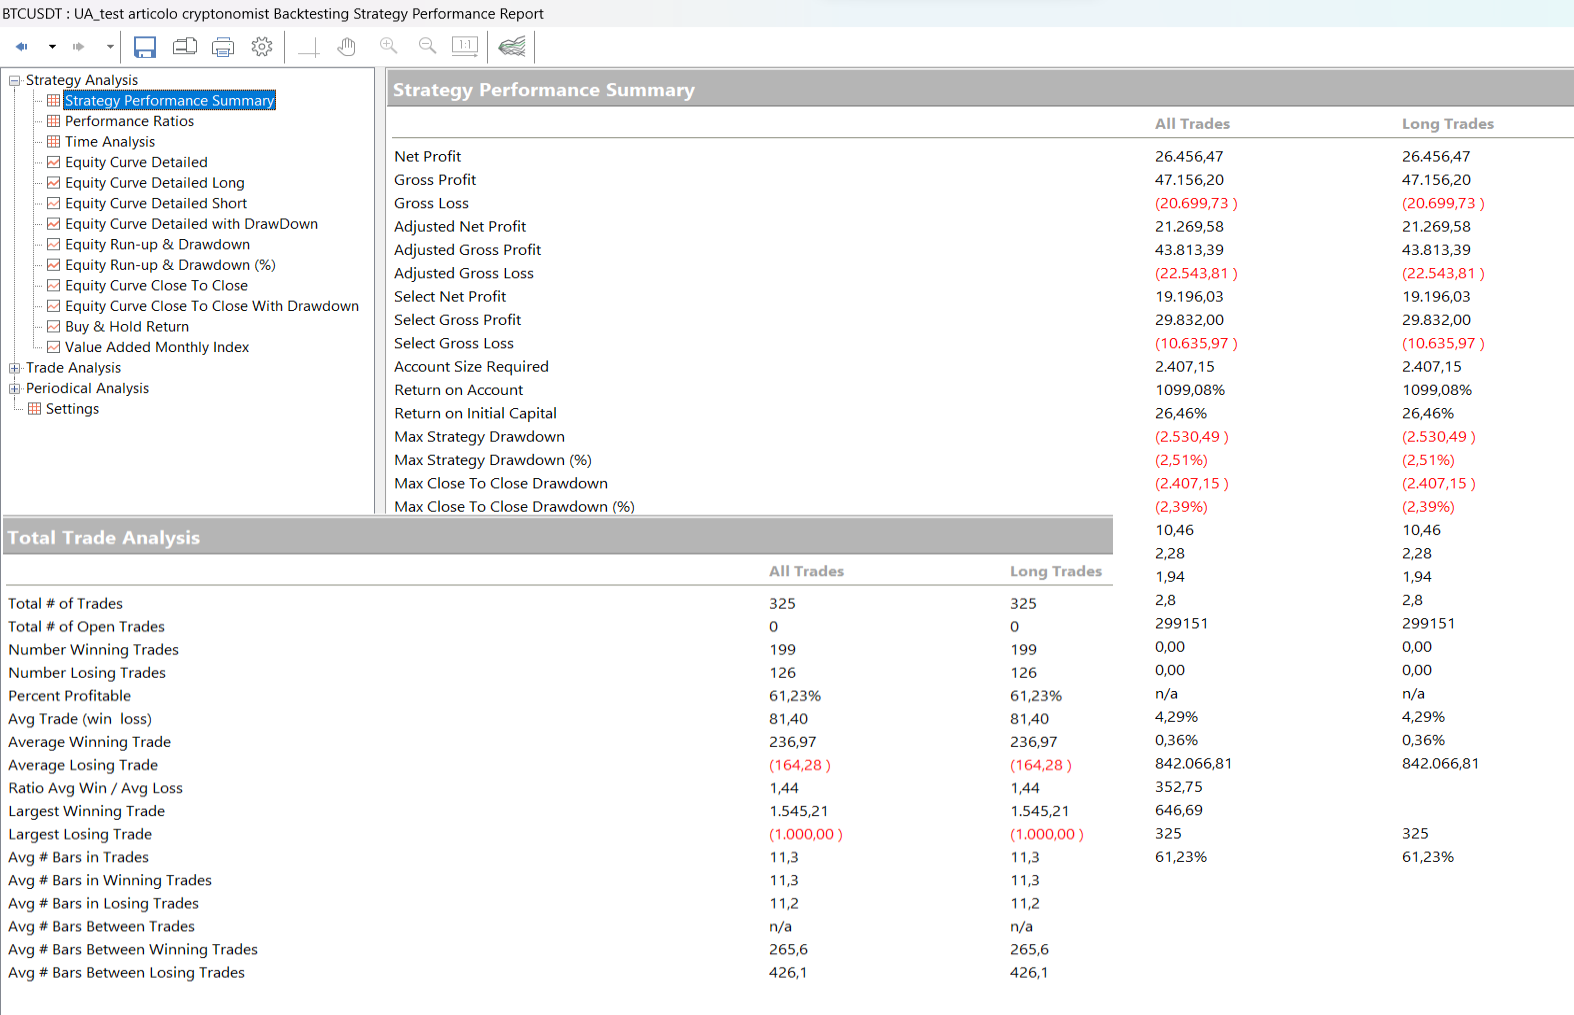
In figures 2 and 3, you can see the results of the strategy just illustrated from 2017 to today.
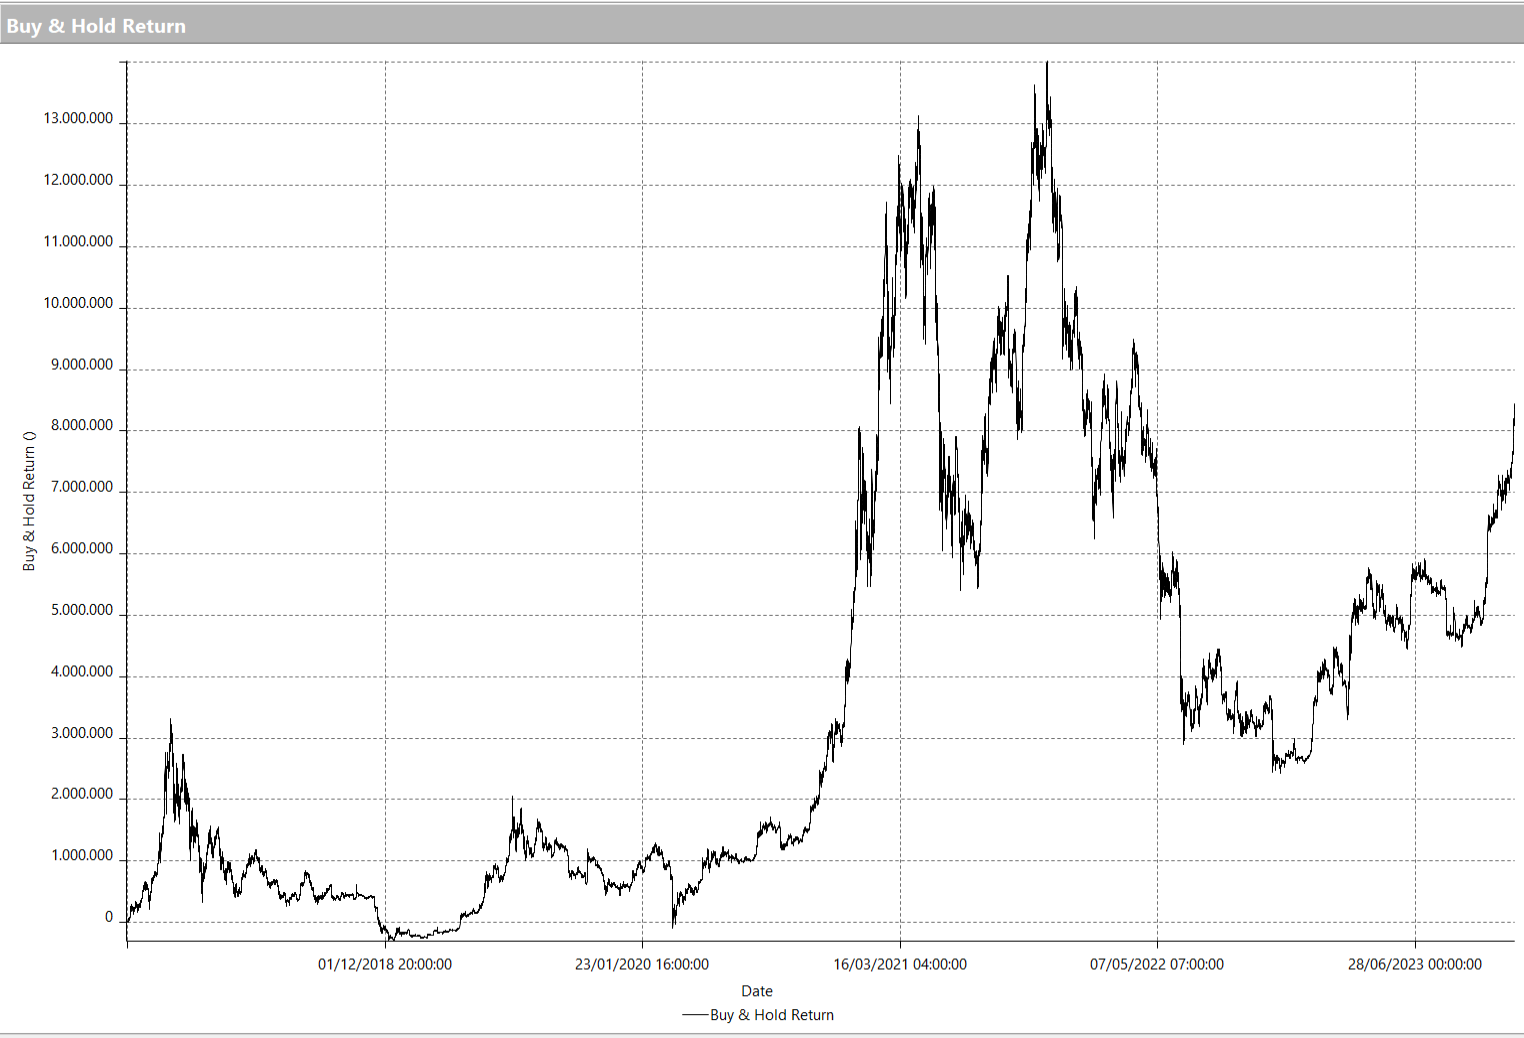
Comparison with Buy & Hold of Bitcoin (BTC)
As you can see, the system shows a growing equity line (cumulative curve of profits and losses) and above all very regular, which would have generated profits in all years of the backtest. Even the average trade (the average value of each individual operation) would have been excellent, with a value of over $80, close to 1% of the invested counter value in each trade.
A decidedly good result considering that it is a very simple system with few rules. It should be noted that if Bitcoin (BTC) had been held in the portfolio during the same period with the classic buy&hold strategy, much more would have been earned, but with drawdowns also much higher than 50%, objectively unsustainable.
Position sizing application
Until now, the strategy has been analyzed using a fixed size for trades. However, given the particular nature of Bitcoin (BTC), it would be interesting to also analyze some aspects related to active contract management and therefore a more advanced method of position sizing.
To do this, you could use the concept of volatility not only for calculating inputs as done so far, but also to determine the size to enter a position. The underlying idea could be to increase or decrease the purchased size based on it.
Therefore, the so-called “volatility position sizing” will be used, sizing the position and its respective stop loss to the market volatility in which one operates. To do this, the average true range referred to the previous two days will be used. Also in this test, profits will not be reinvested.
In figure 5 it is possible to see the results of the optimization with various levels of volatility position sizing. Increasing levels of tolerated volatility, represented by the input “risk”, are accompanied by increasing net profits, always higher than what is obtained with a fixed size of $10,000.
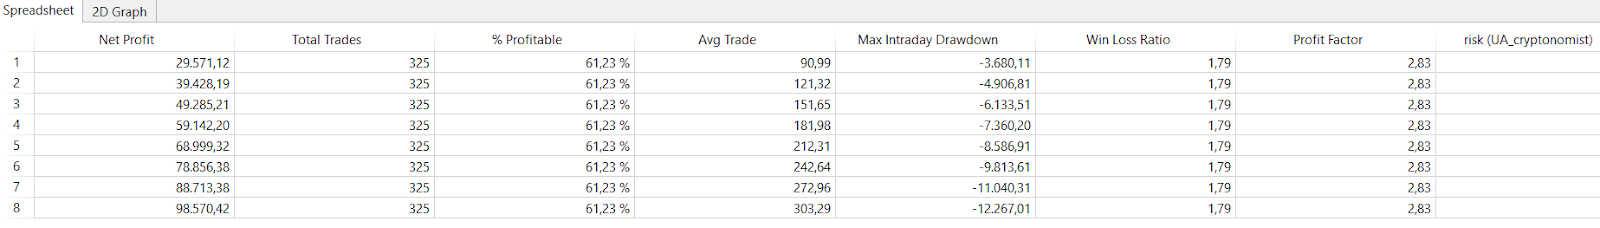
From the results obtained, it is evident that this method proves to be particularly effective in markets that have good granularity and scalability, such as cryptocurrencies. Definitely a strategy to delve into and consider for its applicability to real trading.
There is only one last piece left to complete the analysis, which is to verify if there are more suitable stop loss values for intraday trading and if applying a profit target can bring additional benefits.
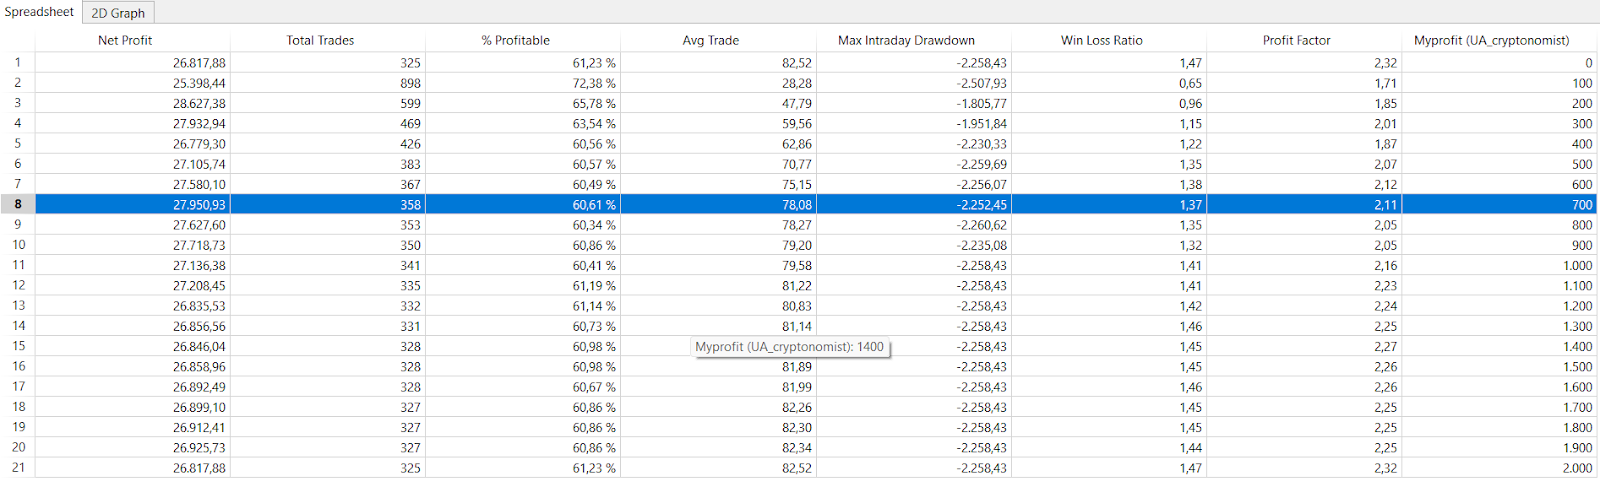
Therefore, the input of the stop loss will be optimized with a range between 0 (no stop loss) and 1,000 (currently applied value and equal to 10% of the position), and the profit target will always start from 0 (no profit) to 2,000 (equal to 20% of the position) with steps of 100. To perform this optimization, the fixed size of $10,000 will be used again.
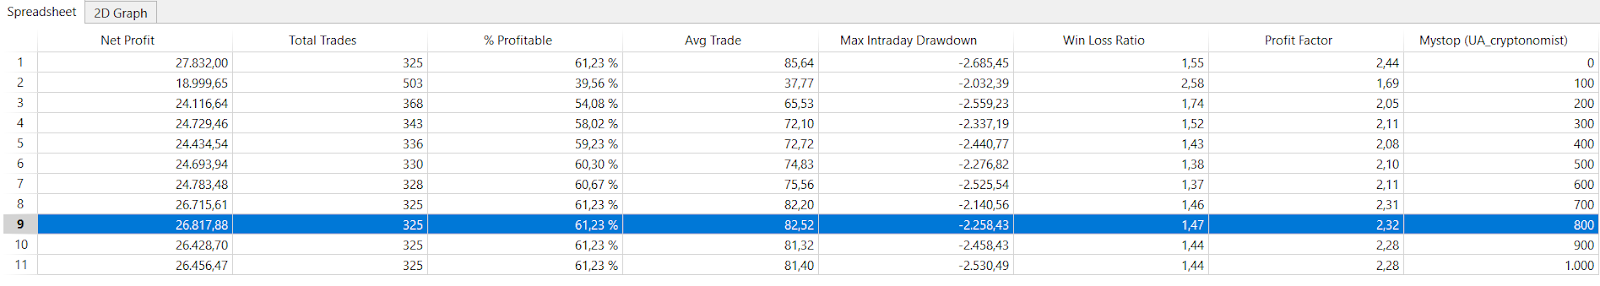
Regarding the stop loss (figure 6), it can be noticed that the best net profit is obtained with a value of zero, which means not having a stop loss; this could be due to the fact that the system stays in the market for a short time being intraday and enters after volatility explosions on the upside, therefore with a strong and well-defined trend. However, considering the instrument in question, it is strongly advisable to have a safeguard stop loss, even if wide. Therefore, it is decided to choose the value of $800 considering the stable surroundings and the good net profit of almost $27,000.
As for the profit target (figure 7), it is evident that it is a parameter that does not drastically affect the metrics, considering the intraday nature of the system. If one still wanted to opt for its inclusion, one could consider choosing $700, or alternatively $800, in order to further improve the net profit and bring it to almost $28,000.
Conclusions on the volatility breakout strategy on Bitcoin (BTC)
The results of the strategy analyzed in this article are potentially very interesting and once again confirm that a trend following approach on Bitcoin (BTC) achieves rewarding results in terms of both consistency and stability of the curve, compared to the traditional long-term holding.
I would say that it is an additional “weapon” in our trading arsenal to face this market, considering that we are also on the eve of the new “Halving 2024” which occurs every four years and generally brings positive seasonality for the entire crypto world.
Until next time and happy trading!
Andrea Unger

