Bitcoin and Ethereum have started the year in the best possible way, marking two excellent price rallies, with the king breaking the key resistance of $45,500 and the queen returning to $2,400.
The expectations of traders and the crypto community can only be blatantly bullish: the first Bitcoin spot ETF in the USA could be approved this week, opening the doors to a large amount of institutional liquidity for the entire crypto sector.
The price targets for the short/medium term are now $50,000 for BTC and $3,000 for ETH: will the market players be able to reach these values by the end of January?
Let’s take a look at some indicators on derivatives such as open interest, liquidations, and funding rate to better understand the nature of this latest pump.
All the details below.
Summary
Bitcoin starts the year with a bang and aims for $50,000, Ethereum follows the king and goes for $3,000: price analysis
2024 starts immediately with the first price increase for Bitcoin and Ethereum, which between yesterday and this morning have recovered all the dump of the previous days, reaching new local highs at $45,500 and $2,400 respectively.
The total market capitalization of the crypto sector has returned above $1.7 trillion, while BTC dominance has resumed its climb, recovering the 52% level after a few weeks of downtrend.
All eyes are currently focused on the Securities and Exchange Commission (SEC) which in the coming days could approve the first Bitcoin spot ETF in the United States, considering that the applications of many fund managers such as BlackRock, Ark, VanEck, and Bitwise are approaching the “final deadline”.
There are rumors circulating about the alleged approval for the ETF of BlackRock coming this Friday.
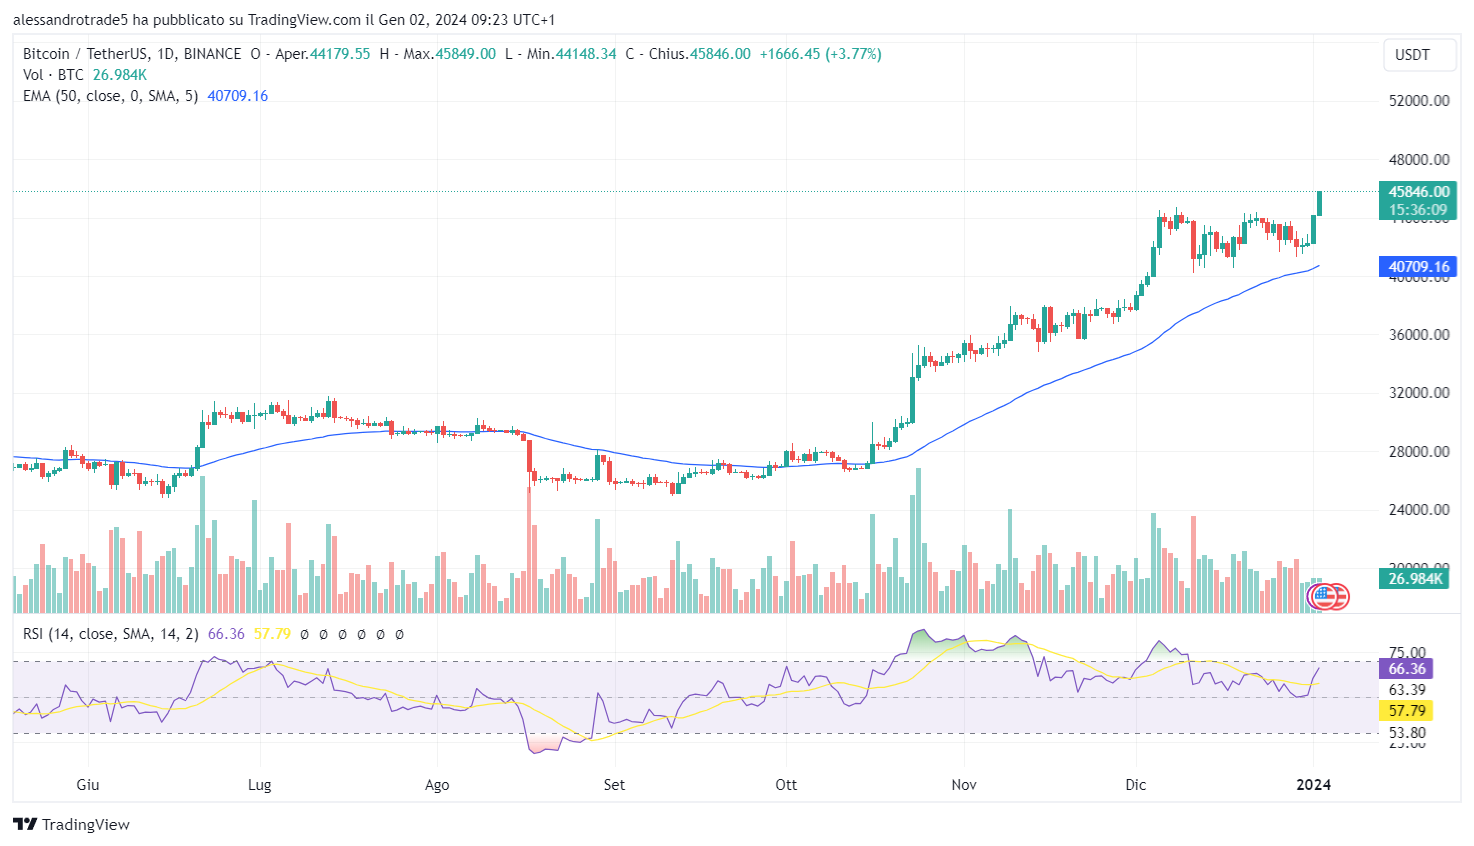
Leaving aside the ETF issue and focusing on the charts, we can easily observe how the last two daily candles, both for Bitcoin and Ethereum, are particularly important for the price action of the two assets.
BTC in particular, with the latest price increase, has reached a new local high that has not been reached since April 2022, opening the doors to new horizons.
The last movement unfortunately has been accompanied by mediocre market volumes, typical of a holiday where traders from large investment funds are resting.
This is not in itself a positive thing and signals the possibility of a potential bull trap in the next few hours. However, it is still too early to firmly state that the volumes have not arrived and we should re-observe the data at the end of the week.
On the RSI front, we see that there is still room for a continuation of the current bullish pattern, which could be interrupted, however: it is worth noting the presence of a bearish divergence between the prices at the beginning of November and the current ones.
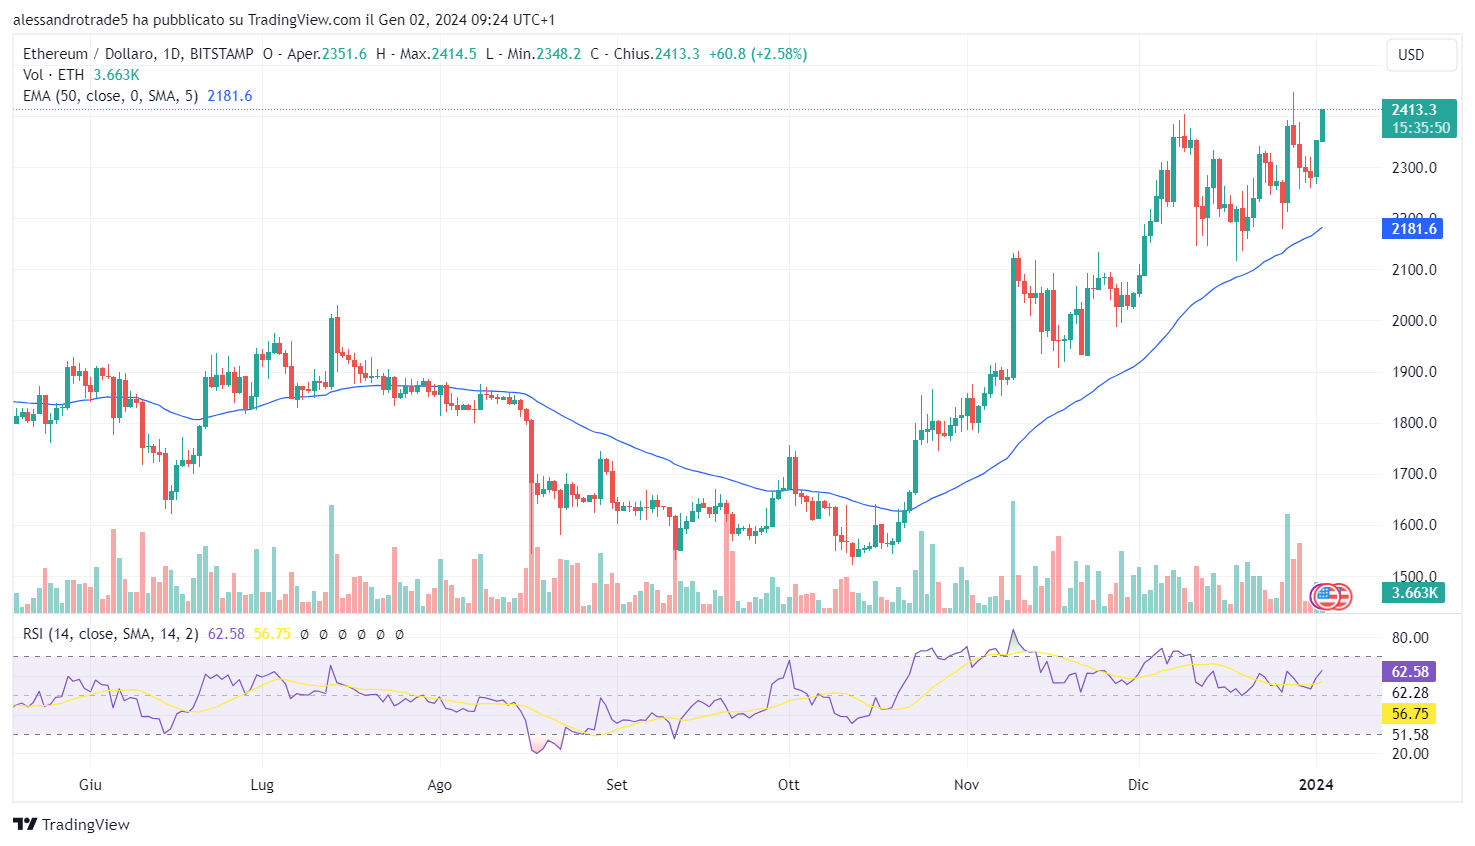
As for Ethereum, the situation is quite similar: the price pump of the last two days has brought the second cryptocurrency in the market above the key level of $2,400, reviving traders’ hopes after the brief retracement at the end of the year.
ETH has moved less convincingly compared to BTC, with a more timid upside break accompanied by very low volumes: in this case as well, to better evaluate this data, it would be appropriate to calculate the volume trend at the end of the week.
Here too, the RSI allows for another bullish leg up but signals the possibility of a reversal dictated by a bearish divergence, in this case less pronounced than the one recorded on the Bitcoin chart.
The overall situation remains clearly positive: the market sentiment is positive but not yet in fomo with many traders increasing their long positions.
New price increases could arrive in the coming days, marking the start of the real bull run of 2024.
The situation of BTC and ETH in the derivatives markets: a look at open interest, funding rate, and liquidations
To better understand the price trends of Bitcoin and Ethereum and to understand that in January they could reach $50,000 for the former and $3,000 for the latter, we necessarily need to take a look at the derivatives market.
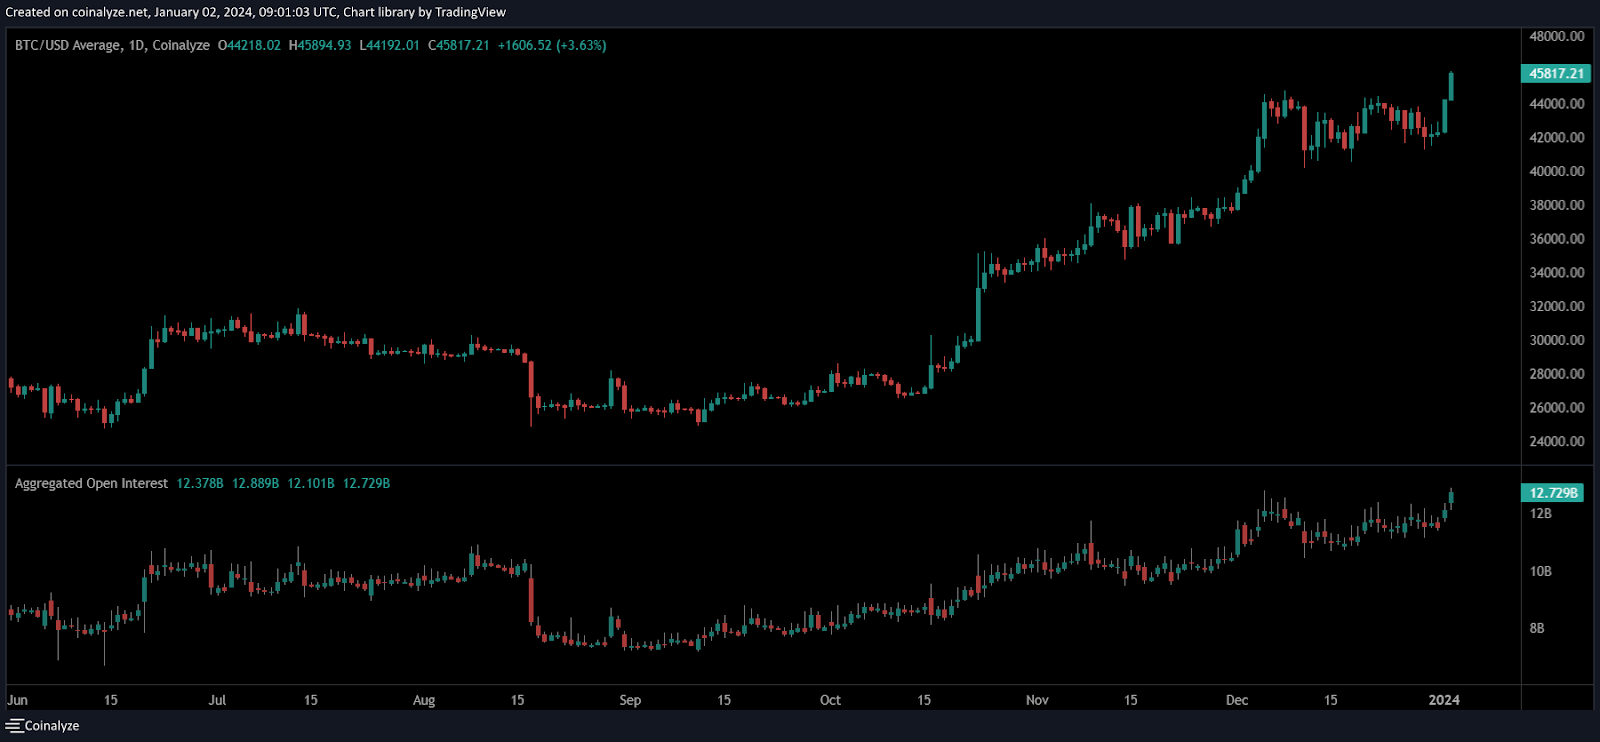
First of all, what stands out the most is the data regarding open interest on perpetuals and options: while the spot volume on BTC and ETH remains low, the OI of both assets in the counterpart with the dollar has been increasing in recent days.
On Bitcoin, the latest rally has brought this indicator to a value exceeding 12.7 billion dollars, which had not been reached for several months.
Same trend also for ETH, with its open interest reaching a value of 6.5 billion dollars but without marking a new local high.
This factor indicates that the market’s attention is currently mainly on Bitcoin.
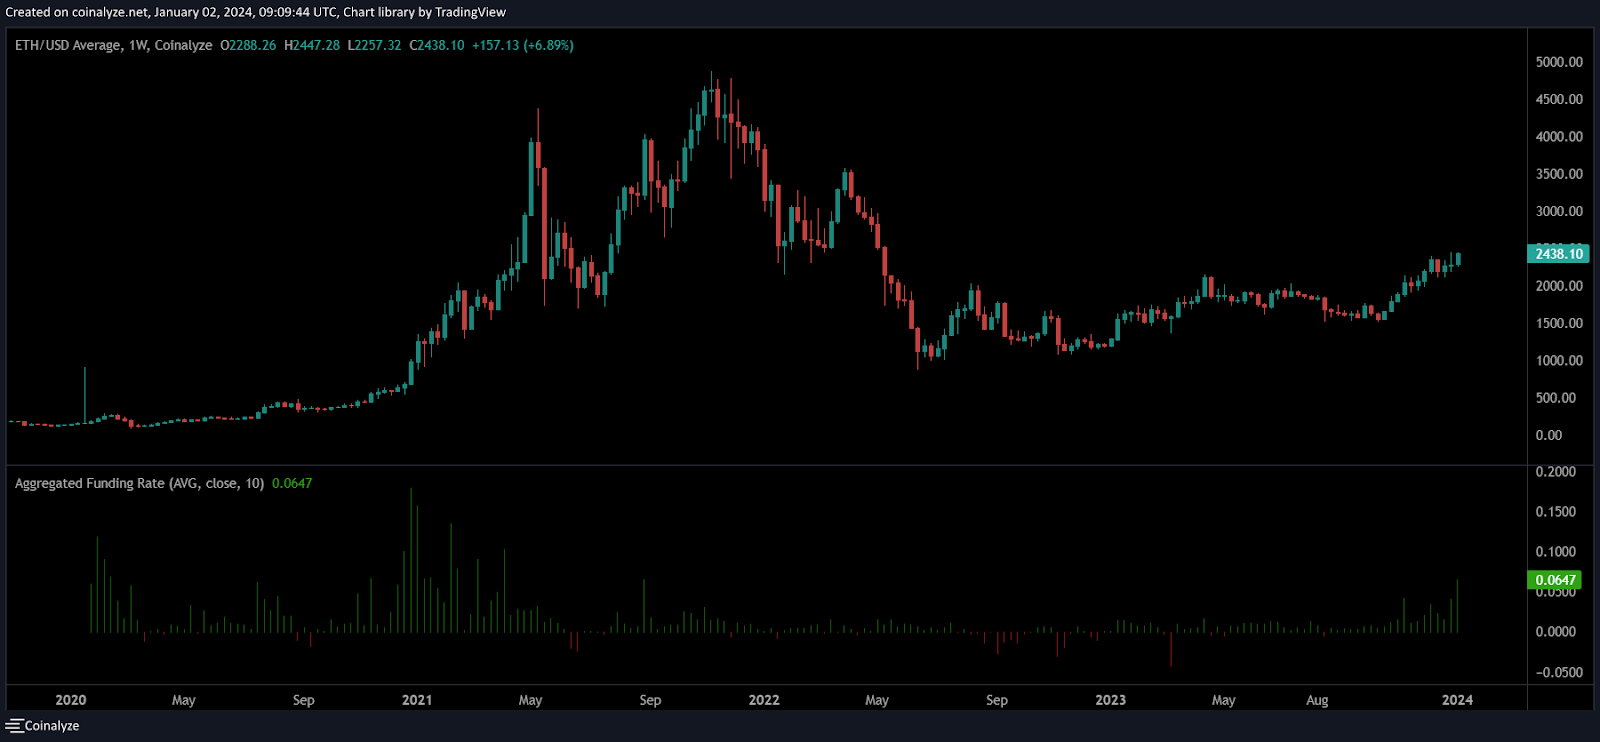
The funding rate for both Bitcoin and Ethereum is strongly positive: this means that long positions are demanding a lot of financial leverage and have to pay the shorts for the borrowed liquidity.
In particular, for digital gold, the financing rate is 0.048%, while for cryptographic silver this figure rises to 0.064%. Both rates are paid every 8 hours of trading on perpetual and inverse swap markets.
It is worth noting that for Ether, there has not been such a high funding rate since September 2021, in the final act of the last price bull run.
Same situation for Bitcoin but much less pronounced, with traders demanding less leverage compared to key moments in 2021.
This indicates that the majority of the more aggressive speculations are focused on ETH.
Finally, to provide a complete overview of the situation regarding the derivatives market, we need to observe the most important liquidation levels where greater liquidity is concentrated for both crypto assets, in order to understand where a squeeze could occur and in which direction.
First of all, it is worth noting that in the last 24 hours the major liquidations have mainly affected shorts rather than longs.
In detail: 75 million dollars in short liquidated on Bitcoin and 16 million dollars in short liquidated on Ethereum. The long liquidated on both cryptos have negligible values.
On Ether, the price levels to keep under control are $2,500 for a bullish continuation: a break of this level could trigger a new rally with a target of $3,000.
On the opposite front, a break below $2,300 could liquidate several long positions, reversing the dominance dynamics in the short term and triggering a downside squeeze.
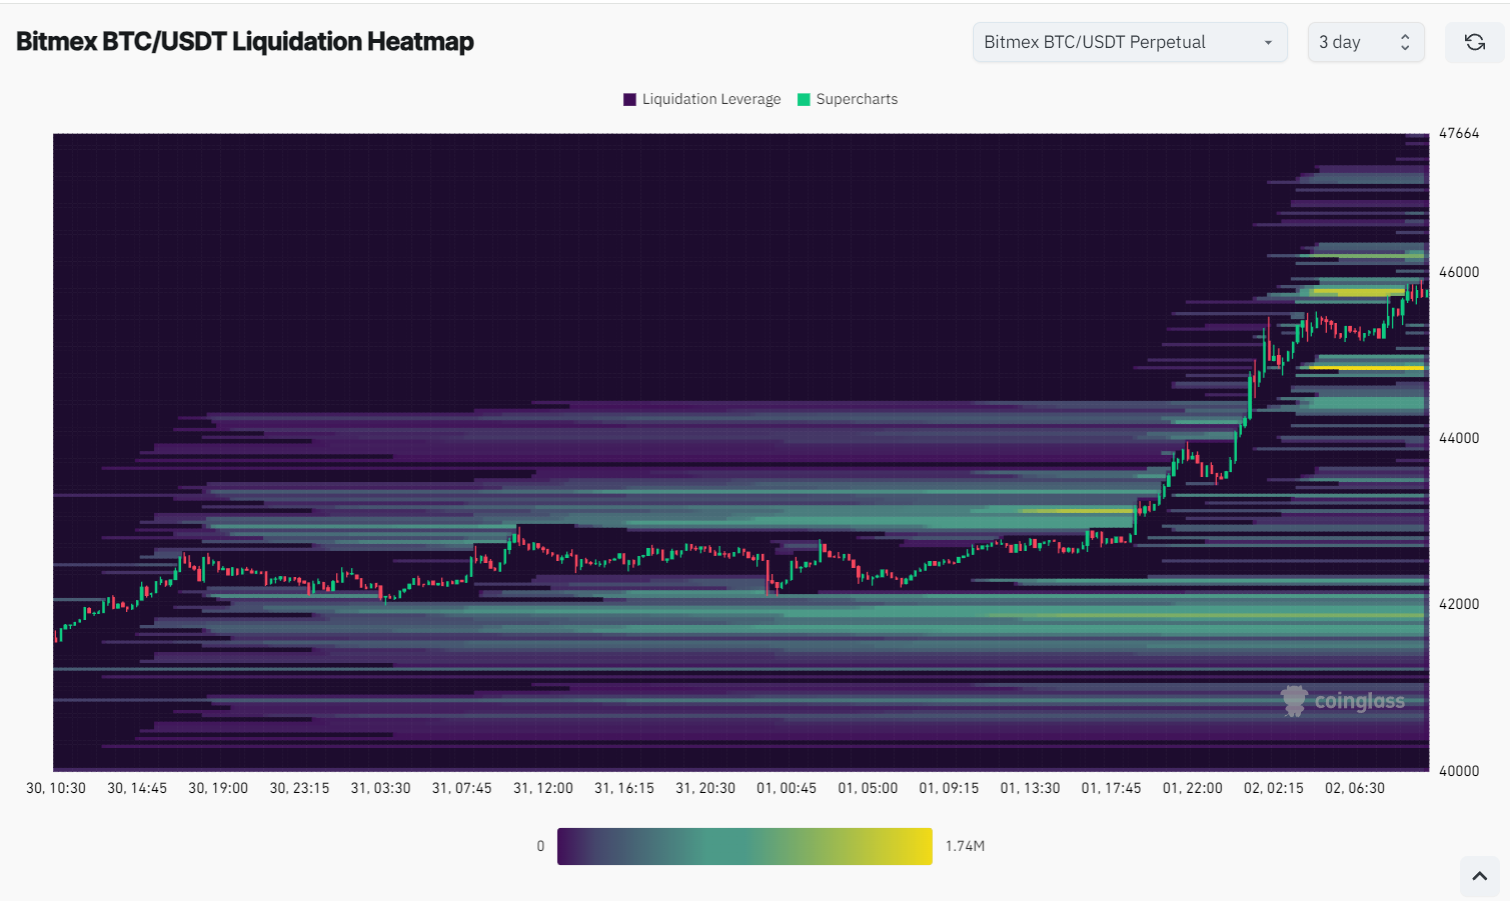
For Bitcoin, instead, as highlighted in the liquidation map of the BTC/USDT chart on Bitmex, the majority of short liquidity is concentrated around the $46,000 threshold: a break of this price would inevitably lead to a bullish squeeze with a target of $50,000.
On the opposite front, a bearish inclination below 45,000 first, and then 42,000 dollars, could cause a violent decline.