

The cryptocurrency market enters late June 2026 with sentiment at rock bottom, and the Shiba Inu price reflects that unease clearly. An Extreme Fear reading of 17, paired with elevated Bitcoin dominance, leaves SHIB under sustained bearish pressure with no confirmed reversal yet.
Summary
Key takeaways
- SHIB trades within a bearish daily regime with RSI hovering near 30.3, lacking any confirmed reversal signal on the D1 timeframe.
- Bitcoin dominance above 56% continues draining capital from altcoins, placing high-beta meme assets at a structural disadvantage.
- The Fear & Greed Index at 17 (Extreme Fear) historically precedes either capitulation floors or further downside, not neutral consolidation.
- 24-hour volume has dropped 14.9%, signaling declining market participation during the current consolidation phase adjacent to a downtrend.
- A bullish reversal requires a sharp RSI recovery, a plateau in Bitcoin dominance, and sentiment climbing back above 40 — all simultaneously.
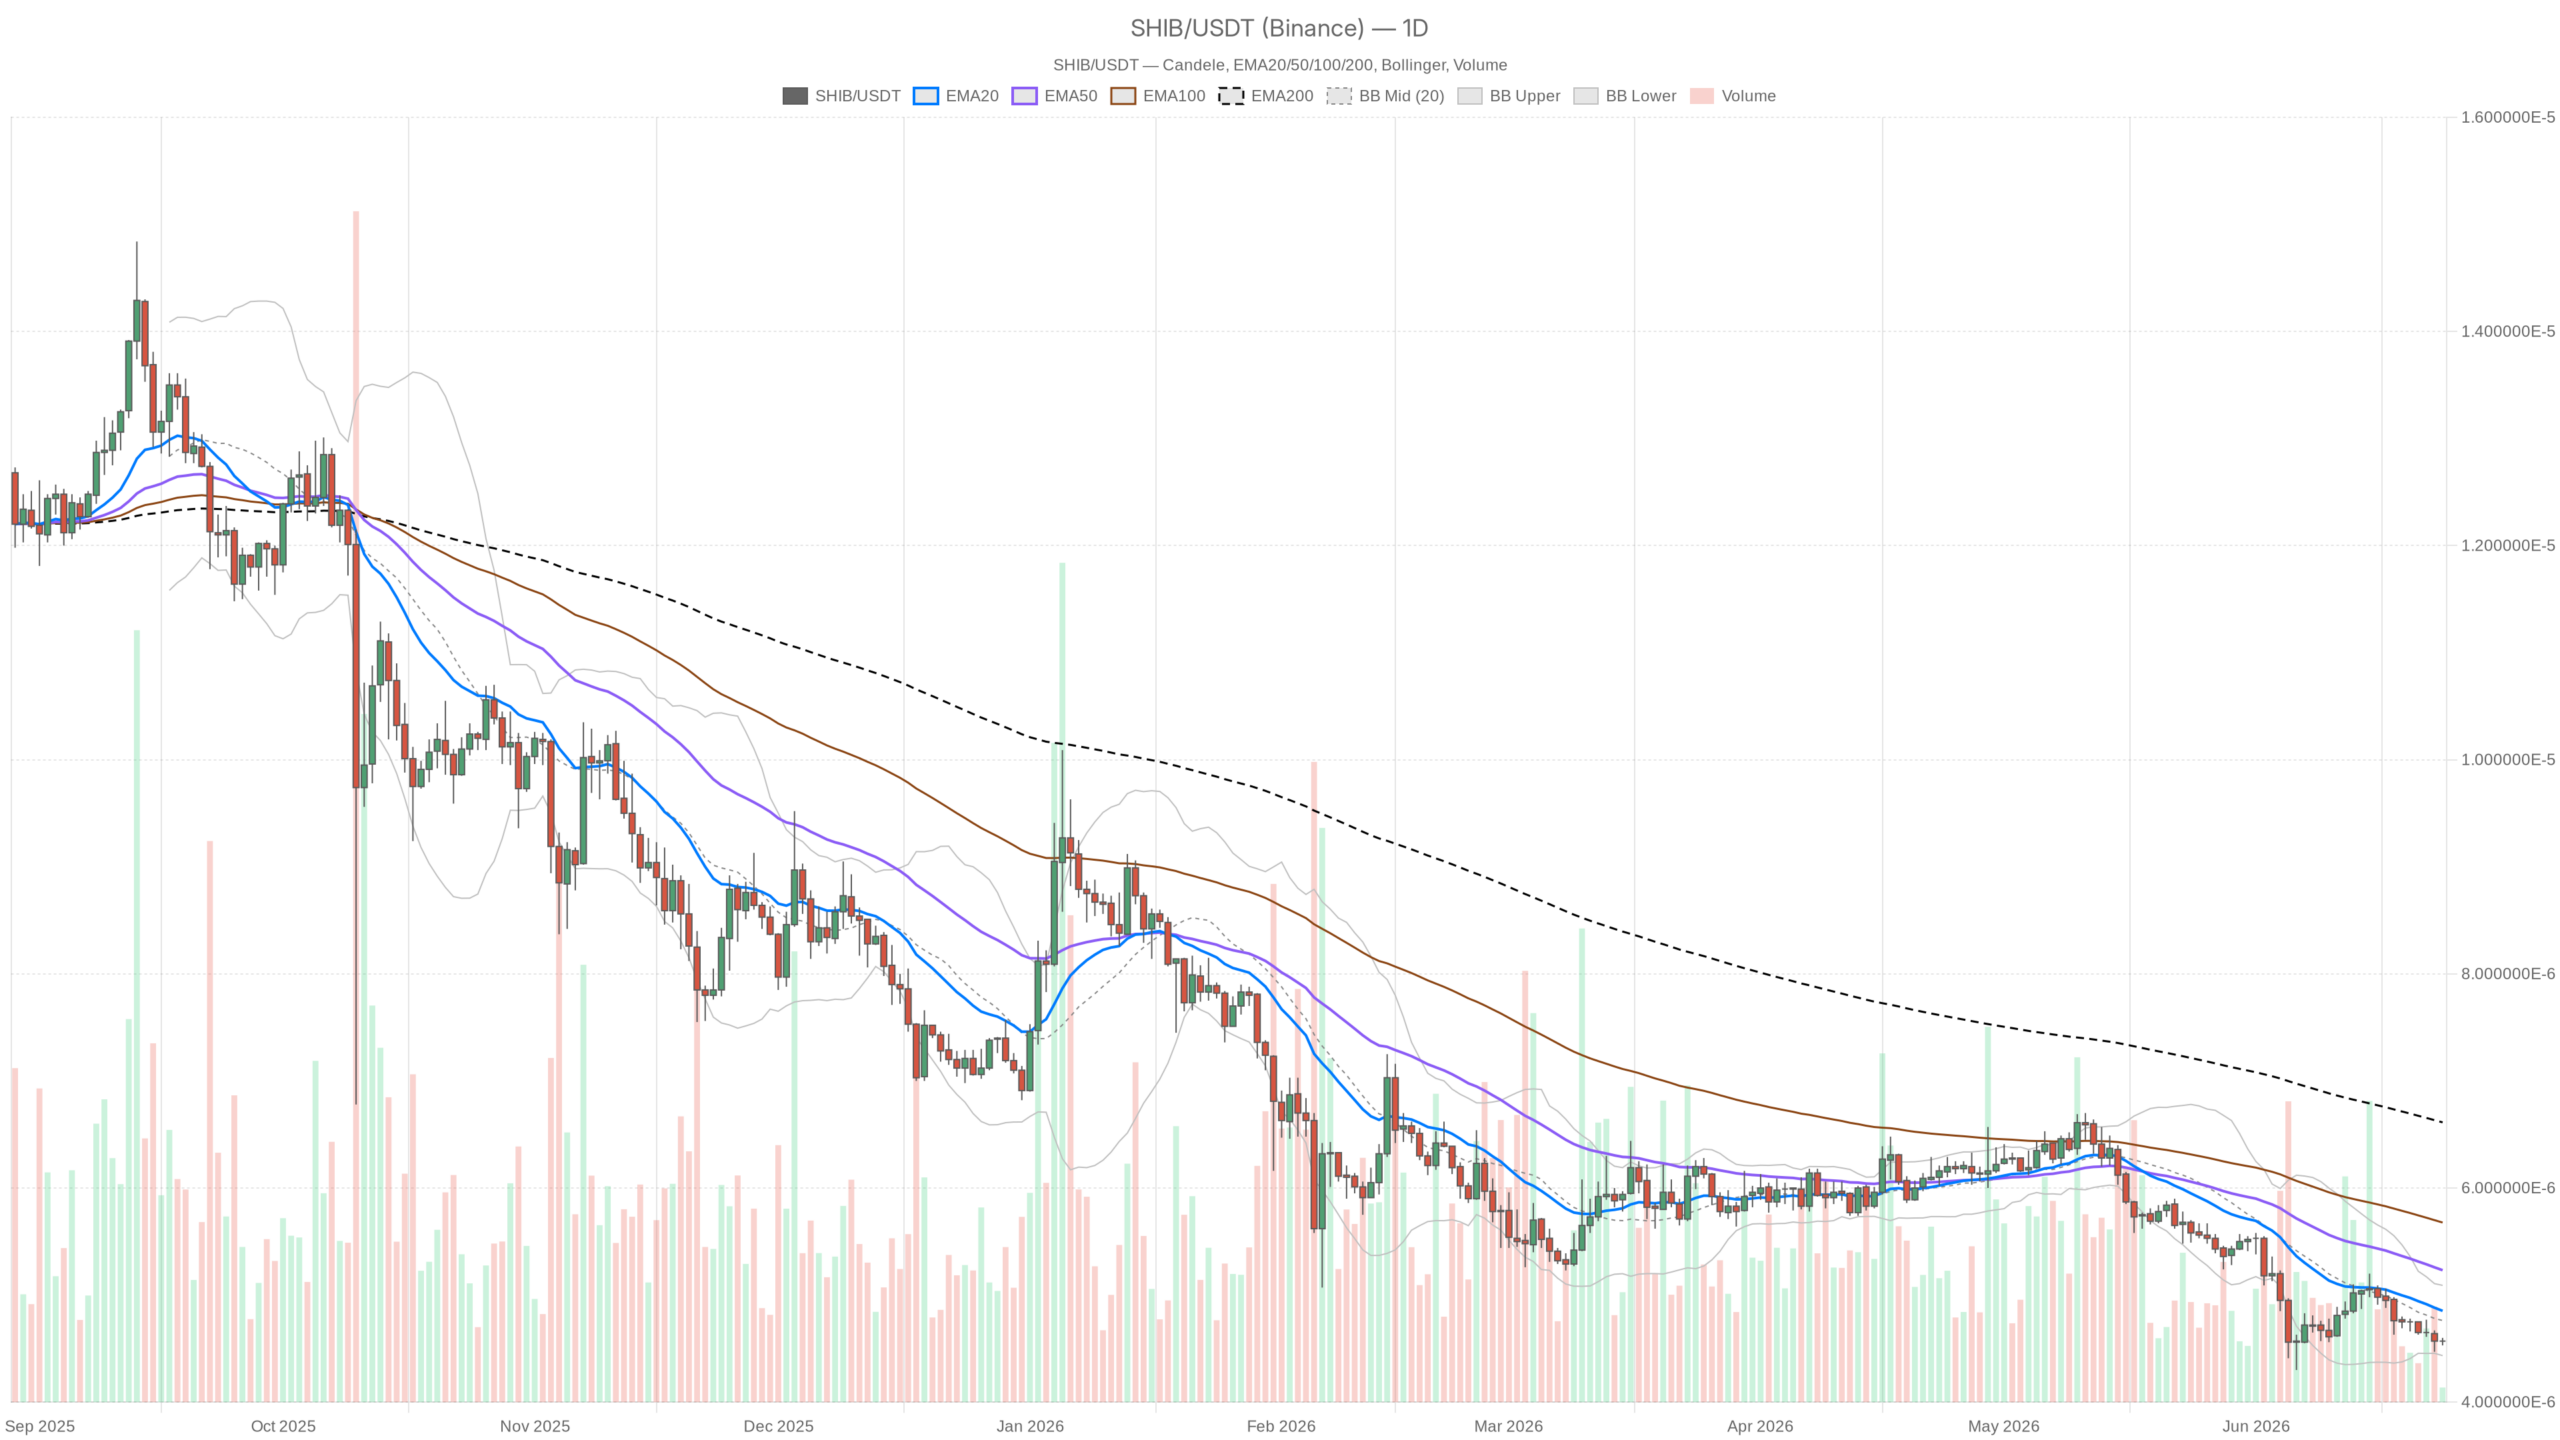
The Daily Picture: Bearish Regime Confirmed
The daily chart shows an unambiguous bearish regime, with the RSI at 30.3 hovering at the edge of oversold territory without crossing into it cleanly. That is arguably the worst place to be, since it means selling pressure has been sustained and consistent, yet no confirmed exhaustion signal has emerged. Markets that linger near oversold without snapping back tend to eventually break through rather than bounce.
Moreover, the MACD on the daily is fully aligned with the broader bearish narrative. The histogram, line, and signal all point in the same direction, confirming that downside momentum has not yet found a structural reversal point. This is not a market quietly reversing under the surface. The path of least resistance remains lower until proven otherwise.
Intraday Neutrality: A Pause, Not a Pivot
The 1-hour chart offers only a marginal shift in tone. The RSI at 48.96 sits mid-range with no directional conviction, and the regime reads as neutral. In the context of a daily downtrend, however, this simply means the selling has paused rather than reversed. Such intraday behavior typically appears during consolidation phases before a continuation move.
Similarly, the 15-minute frame shows an RSI of 52.5 — marginally above center — also registering as neutral. For execution purposes, this micro-timeframe provides no high-conviction entry signals in either direction. When all short-term momentum indicators cluster around the 50 level while the daily remains firmly bearish, the default assumption should be that the daily trend eventually reasserts control.
Macro Backdrop: Where SHIB Lives and Dies
According to CoinGecko data, the total crypto market cap sits at approximately $2.23 trillion, with a 24-hour change of just +0.36% — effectively flat. That marginal green print is noise, not a recovery. More telling is the 24-hour volume change of -14.9%, which signals that participation is draining from the market. Low volume during a consolidation phase adjacent to a downtrend does not favor longs.
Bitcoin dominance at 56.24% serves as the macro anchor here. When BTC dominance is elevated and rising, capital rotates out of altcoins and into the relative safety of Bitcoin. Shiba Inu, sitting far down the risk curve as a meme-origin token, is structurally disadvantaged in this environment. The Fear & Greed Index at 17 confirms the backdrop: scared retail does not buy SHIB.
The Bullish Case: What Would Need to Align
For SHIB bulls, the setup requires several conditions to align simultaneously. First, the daily RSI needs to either push below 30 and then recover sharply — a classic oversold reversal — or start curling upward from current levels with price confirming. Any recovery that fails to bring volume back into the market should be treated with deep skepticism.
Second, Bitcoin dominance would need to plateau or reverse, signaling a rotation back into altcoins. Third, the broader Fear & Greed Index climbing back toward neutral (40+) would remove one of the larger headwinds. If those three conditions stack up together, SHIB has the profile of an asset that can move violently to the upside given its beta characteristics. That said, the bullish scenario gets invalidated if price makes a new local low with the RSI failing to hold above 25–28.
The Bearish Case: The More Probable Path
The bearish scenario does not need much to sustain itself. As long as BTC dominance stays elevated, volume remains thin, and sentiment lingers in the fear zone, SHIB will struggle to find buyers with genuine conviction. The 1-hour neutrality is fragile — it represents a pause in selling, not a structural base being built.
If intraday momentum rolls back below RSI 40 on the hourly while the daily holds its bearish regime, the short-term consolidation breaks down and the path of least resistance reasserts itself to the downside. Conversely, this scenario gets invalidated by a sharp, high-volume reversal candle on the daily accompanied by clear RSI divergence — essentially a signal that sellers are exhausted and buyers are absorbing supply.
Positioning and Risk Context
Understanding where the Shiba Inu price sits on the broader risk spectrum is essential for anyone watching this market. This is not a low-volatility setup near a clean support level with a tight invalidation. Rather, it is a bearish-trending asset in an Extreme Fear macro environment with low volume and no confirmed reversal signal. These are precisely the conditions where holding through drawdowns can compound losses quickly.
The constructive read, if you are looking for one, is that Extreme Fear readings of sub-20 do not persist indefinitely. Assets like SHIB tend to produce violent short-covering rallies when sentiment eventually shifts. However, timing those moves without a technical confirmation signal is speculation, not analysis. The patient approach is to wait for the daily chart to show its hand: either a confirmed oversold reversal with volume, or a clean break lower that resets expectations for where meaningful support actually lies.
Nothing in this analysis constitutes financial advice. Market conditions can shift rapidly, and the scenarios outlined here reflect a technical read of available data as of June 24, 2026 — not a prediction of future price action.
FAQ
Is SHIB currently in a bear market?
Yes, the daily chart shows a confirmed bearish regime. The RSI at 30.3 hovers near oversold territory without crossing into it, and the MACD histogram, line, and signal all point downward. Until a structural reversal signal appears, the path of least resistance remains lower.
What needs to happen for SHIB to reverse upward?
Three conditions must align: the daily RSI must produce a confirmed oversold reversal with volume, Bitcoin dominance needs to plateau or decline below 56%, and the Fear & Greed Index must climb back toward neutral territory above 40. Missing any one of these weakens the bullish case considerably.
Why does Bitcoin dominance matter for SHIB?
When Bitcoin dominance is elevated, capital concentrates in BTC rather than flowing into riskier altcoins. At 56.24%, the current dominance level signals that the market is in defensive mode. Shiba Inu, as a high-beta meme asset, performs poorly in this environment because scared capital does not chase speculative tokens.
Is an Extreme Fear reading of 17 a buy signal?
Not automatically. While sub-20 Extreme Fear readings historically mark capitulation floors, they can also precede further downside. Without a confirmed technical reversal — such as an oversold RSI bounce with rising volume — buying into Extreme Fear alone is speculative rather than analytical.
Disclaimer: This article is for informational purposes only and does not constitute financial advice, an investment recommendation, or a solicitation to buy or sell any financial instrument or cryptocurrency. The analysis provided is not indicative of future results. Investing in crypto assets and financial markets carries a high risk of capital loss. Always do your own research (DYOR) and consult a qualified financial advisor before making any decision.
Article produced with the assistance of artificial intelligence and reviewed by the editorial team.