




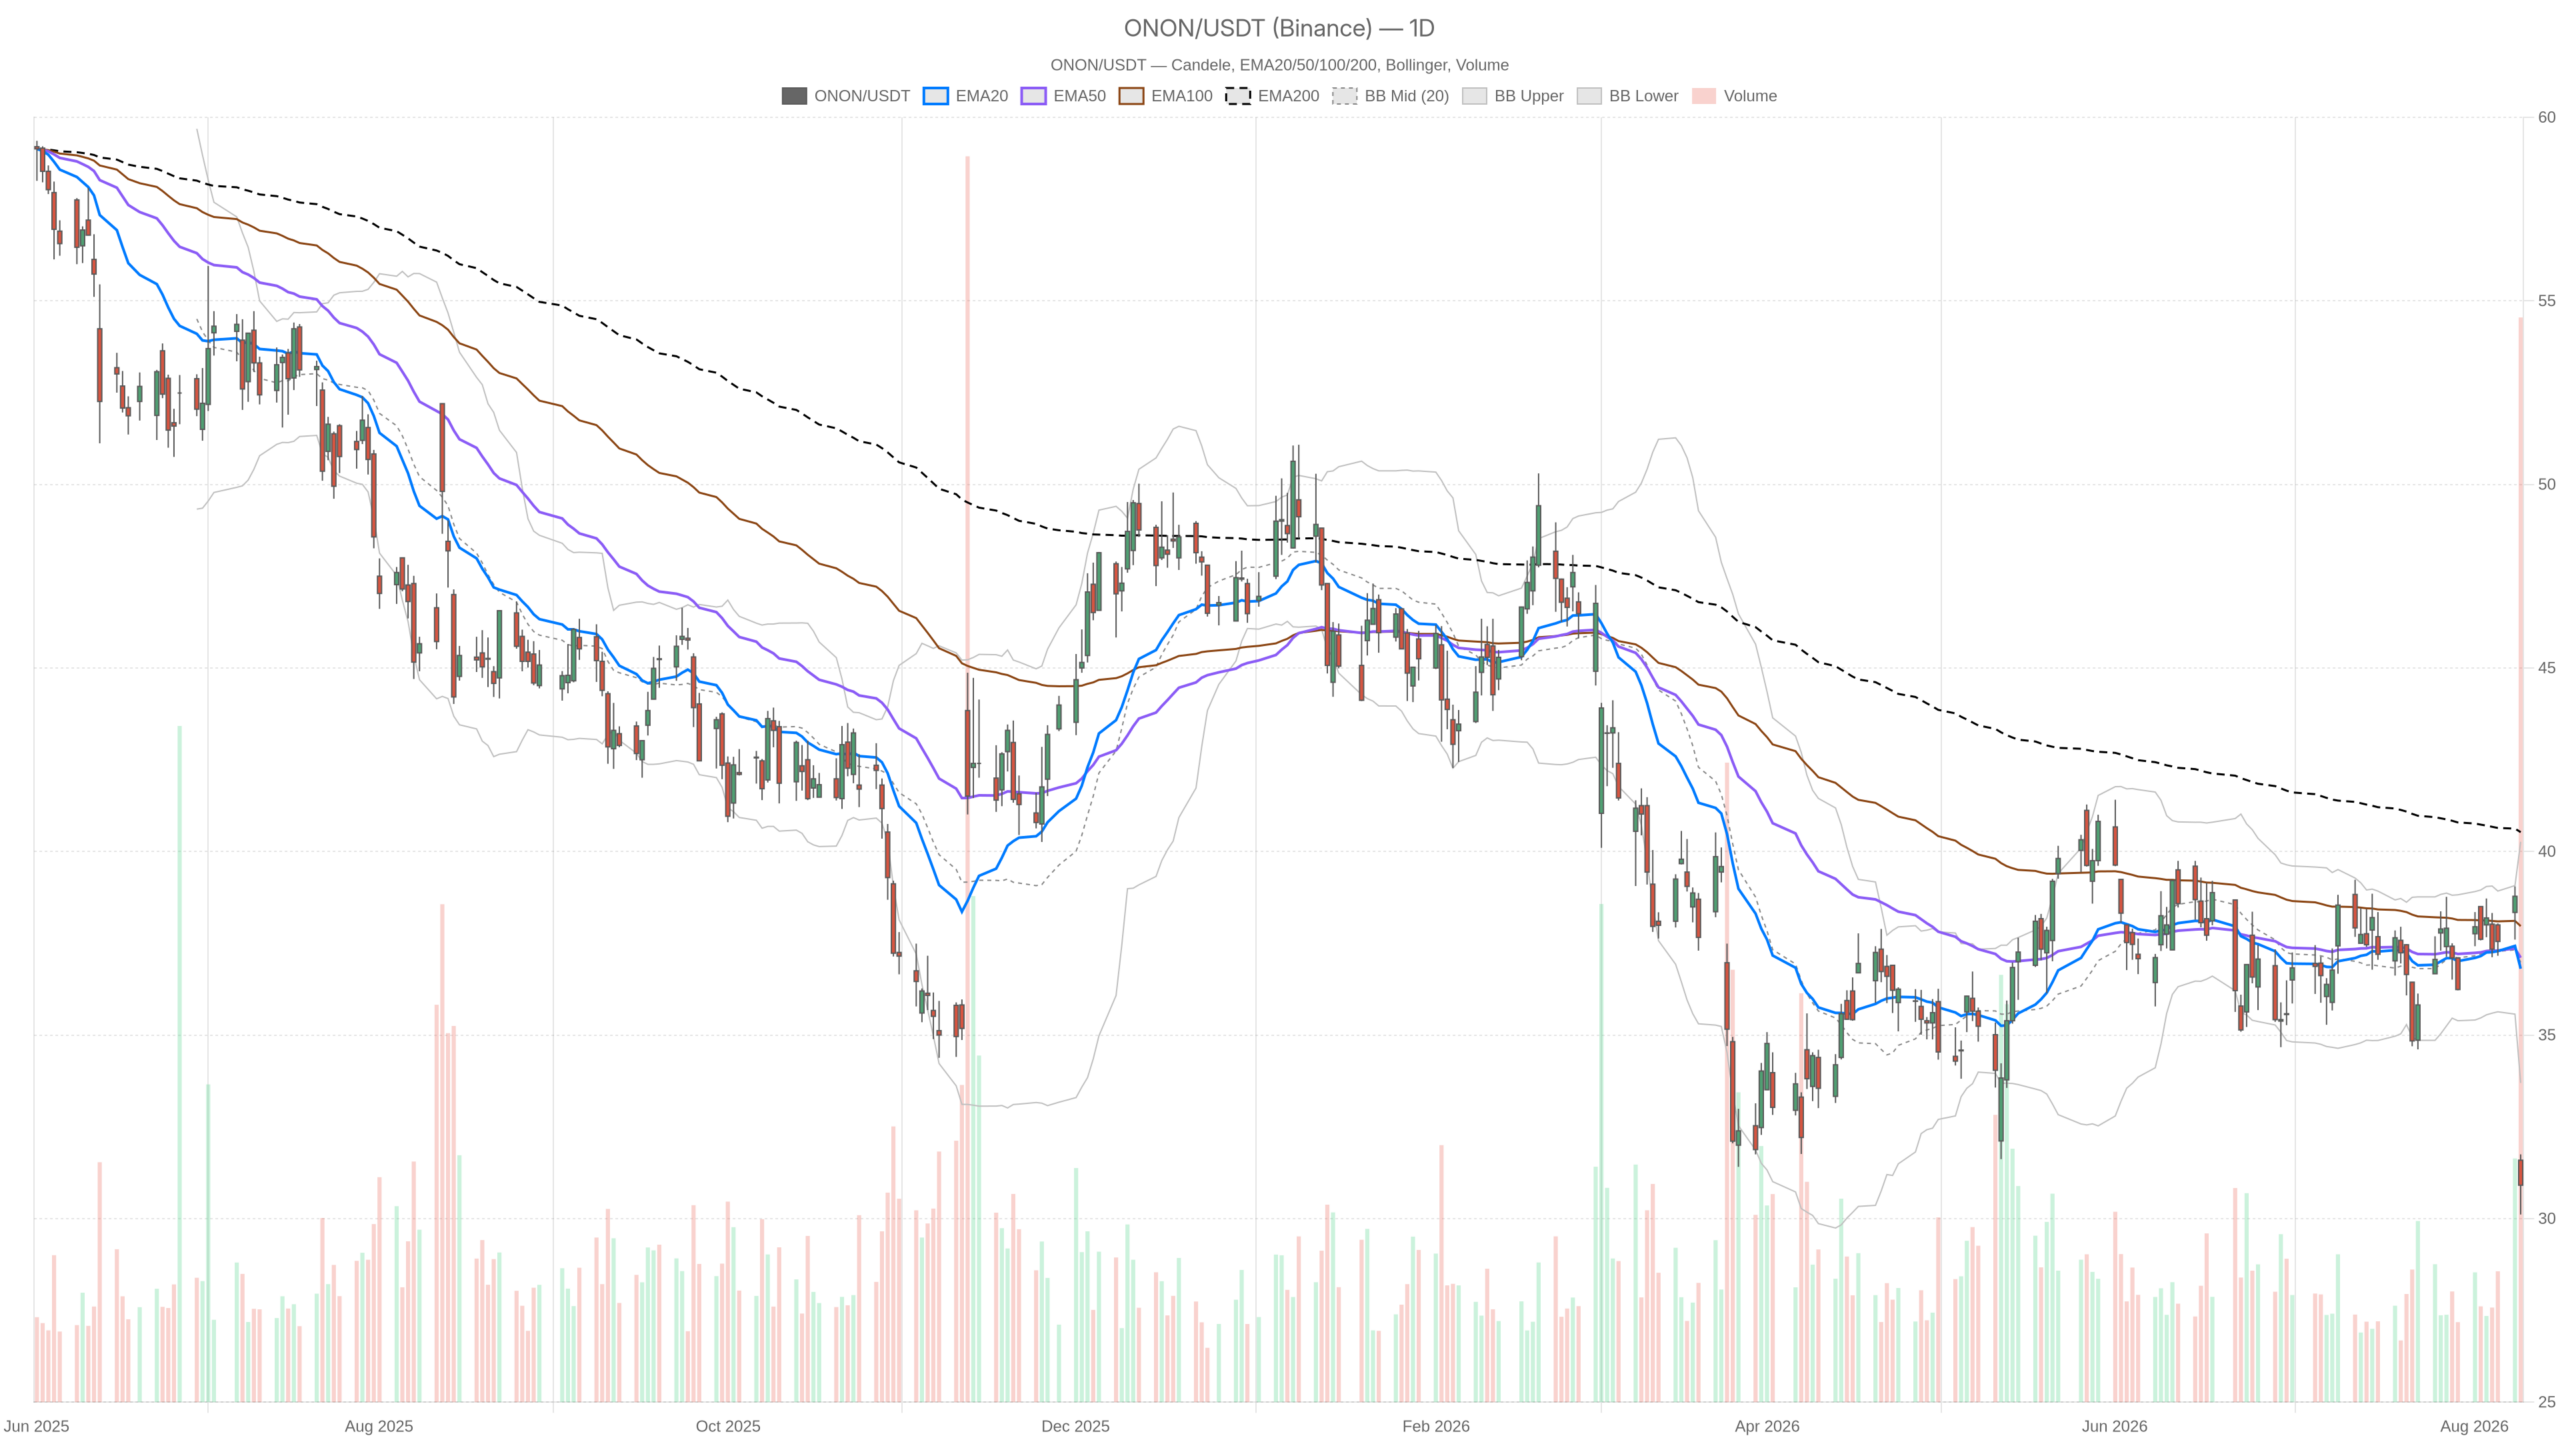
On Holding stock (ONON) closed at 30.91 after a brutal post-earnings selloff. Price now sits below the 20-, 50- and 200-day EMAs and beneath the lower Bollinger band. The daily bias is firmly bearish, with no meaningful contradiction on shorter timeframes yet.
Summary
Key takeaways
- ONON plunged 16% after Q2 2026 results missed sales expectations and revealed cooling growth in the Americas.
- Price at 30.91 trades far below all major daily EMAs: 20-day at 36.81, 50-day at 37.11 and 200-day at 40.53.
- Daily RSI14 at 31.96 approaches oversold territory, while hourly RSI14 has collapsed to deeply oversold 18.96.
- William Blair downgraded the stock on wholesale concerns, but other analysts defended the name citing DTC strength.
- A daily ATR of 1.93 translates to roughly 6% average daily swings, amplifying both directional and whipsaw risk.
Daily structure: On Holding stock is stretched, not stabilized
The daily chart confirms a bearish trend with price trading far beneath every major moving average after a high-volume distribution event.
Q2 2026 results triggered the 16% plunge. Headlines pointed to a sales miss and cooling growth in the Americas, On’s largest region. DTC sales rose 34%, but the market priced the regional slowdown instead. William Blair downgraded On Holding stock on wholesale concerns. Meanwhile, other analysts defended the name. One upgrade framed the selloff as a value opportunity. That split in the narrative is precisely why the chart matters more than usual right now.
Moving average stack confirms bearish regime
The daily moving average stack tells the story quickly. EMA20 sits at 36.81, EMA50 at 37.11 and EMA200 at 40.53. Price at 30.91 is far beneath all three. That wide gap confirms a trend-following bearish regime, not a simple pullback inside an uptrend.
Bollinger breakdown signals volatility expansion
Volatility has expanded violently. Daily ATR14 stands at 1.93, meaning roughly 6% average daily range at current levels. The Bollinger structure is more revealing: mid band at 36.98, upper at 40.26 and lower at 33.70. Closing below 33.70 means the move broke decisively out of its statistical envelope. Such extensions often invite short-term mean reversion. However, they also mark genuine regime change when following a fundamental shock—which is the case here.
Momentum builds without reaching exhaustion
Momentum is weak but not yet exhausted in the classic sense. Daily RSI14 reads 31.96, close to oversold without confirming it. Meanwhile, MACD is negative, with the line at -0.33 below the signal at -0.01. The histogram of -0.32 shows downside momentum is still building rather than fading. Notably, volume of 42.2 million on the breakdown session reinforces that this was distribution, not drift.
Pivot levels frame the immediate battleground
The daily pivot map is tight. Pivot sits at 30.92, essentially where price closed. R1 is at 31.74 and S1 at 30.10. In practice, 30.92 is the immediate battleground. Above it, buyers can attempt a probe toward 31.74. However, below 30.10, the path opens toward fresh lows with little visible structural support.
Hourly view: confirmation, with an oversold warning
The 1H chart fully confirms the daily bearish bias. Yet deeply oversold readings warn that selling intensity cannot persist without at least a pause or a relief bounce.
Bearish alignment and layered resistance
The 1H chart confirms the daily bias without hesitation. EMA20 at 34.59, EMA50 at 36.20 and EMA200 at 37.01 are all stacked above price. That is textbook bearish alignment on the intraday trend. Consequently, any rally faces layered resistance well above the current 30.91 print, leaving little room for bullish follow-through without a structural shift.
Oversold extremes and resolution paths
Hourly momentum, however, is at an extreme. RSI14 has collapsed to 18.96, deeply oversold. MACD remains firmly negative at -1.86 against a -1.11 signal, with the histogram at -0.75. Trend and momentum agree on direction. Yet the intensity is unsustainable in the very short run. Readings this depressed usually resolve in one of two ways: a sharp relief bounce, or a grinding sideways base while momentum resets. Neither implies a trend reversal by itself.
Volatility context and pivot compression
Hourly volatility supports that caution. ATR14 of 1.09 on the 1H is unusually wide, showing how much intraday risk has been repriced. The Bollinger range is enormous, from 28.90 to 42.53 with a 35.71 mid. Price sits far below the mid and only about two points above the lower band. Meanwhile, hourly pivots are compressed at 30.89 pivot, 31.09 R1 and 30.72 S1. This points to a temporary equilibrium after the flush.
15-minute execution context
The 15-minute chart offers the first tentative signs of stabilization, though not yet evidence of a durable bottom.
On the 15-minute chart, there is the first small crack in the selling pressure. MACD line at -1.03 is now above its signal at -1.28, producing a positive histogram of 0.25. At the same time, RSI14 has recovered to 31.27. Price at 30.91 trades just below the 15m EMA20 of 31.44 and hugs the Bollinger mid at 30.98.
Notably, ATR14 on this timeframe has dropped to 0.23. The bands are narrowing to 30.30–31.66. Volatility is contracting after the shock, which is typical stabilization behavior. Still, EMA50 at 33.55 and EMA200 at 36.28 remain far overhead. The short-term improvement is therefore best treated as a pause inside a downtrend, not evidence of accumulation.
Bullish scenario
The bull case hinges on deeply oversold hourly conditions and the emerging 15-minute momentum crossover. Buyers must defend key support clusters for any reversal to gain traction.
The bull case starts with the oversold hourly RSI and the 15m momentum crossover. Buyers would first need to hold the 30.72–30.75 pivot support cluster. A reclaim of 31.07–31.09 and then daily R1 at 31.74 would signal that dip buyers are engaging. This would align with the analyst defence of the DTC and e-commerce story. A push back toward the 15m EMA50 at 33.55 and the daily lower band at 33.70 would mark the first serious repair of structure. Only a sustained move above the daily EMA20 at 36.81 would neutralize the bearish daily regime.
Bearish scenario
The bearish case remains the default. A break below 30.10 would likely accelerate selling, given persistent trend momentum and unresolved fundamental concerns.
A break of daily S1 at 30.10 and the recent 30.11 low would invalidate the stabilization attempt immediately. With a daily ATR of 1.93, a decisive breakdown could travel quickly. The hourly MACD histogram at -0.75 confirms sellers still control the trend. Furthermore, failure to reclaim 30.92 on rising volume would keep wholesale growth concerns—highlighted by the William Blair downgrade—firmly in the driver’s seat.
Overall, ONON is a post-shock chart in which trend and momentum agree on direction. Short-term oscillators scream exhaustion. That combination tends to produce violent, low-conviction swings rather than clean trends. Position sizing matters more than direction here, given daily ranges near 1.93 points and a fundamental narrative that analysts themselves cannot agree on. Until On Holding stock reclaims 31.74 and starts closing back inside its daily bands, rallies remain corrective within a bearish structure. Uncertainty stays elevated on both sides of the tape.
FAQ
Why did On Holding stock drop after earnings?
Q2 2026 results triggered a 16% plunge, driven by a sales miss and cooling growth in the Americas, On’s largest region. Despite DTC sales rising 34%, the market focused on the regional slowdown instead, punishing the stock aggressively.
Is On Holding stock oversold after the selloff?
Yes, on short timeframes. Daily RSI14 reads 31.96, near oversold territory. Hourly RSI14 has collapsed to 18.96, a deeply oversold reading that typically precedes a relief bounce or sideways consolidation. However, neither condition guarantees a trend reversal.
What are the key levels to watch for ONON?
Immediate support sits at 30.10 (daily S1). Resistance starts at 30.92 (daily pivot), then 31.74 (daily R1). A sustained reclaim of 33.70—the lower Bollinger band—would be the first structural repair. Full trend neutralization requires a move above the daily EMA20 at 36.81.
What are analysts saying about On Holding stock?
William Blair downgraded the stock on wholesale growth concerns. However, other analysts defended the name, citing DTC and e-commerce strength. One upgrade framed the post-earnings selloff as a value opportunity, leaving the analyst community split on the outlook.
Disclaimer: This article is for informational purposes only and does not constitute financial advice, an investment recommendation, or a solicitation to buy or sell any financial instrument or cryptocurrency. The analysis provided is not indicative of future results. Investing in crypto assets and financial markets carries a high risk of capital loss. Always do your own research (DYOR) and consult a qualified financial advisor before making any decision.
Article produced with the assistance of artificial intelligence and reviewed by the editorial team.
