


In this article we see the latest updates on the price of Bitcoin: between a daily RSI that has returned almost neutral after a decline in the month of March and discouraging ETF data, the main cryptocurrency in the market is poised between a return above the highs and a heavy retracement.
Let’s see all the details below.
Summary
Analysis of Bitcoin price: RSI daily falls below 50 points and ETFs show a phase of stagnation
After a crazy start to 2024 for Bitcoin where new price records were reached, its outlook now seems to be returning to neutral.
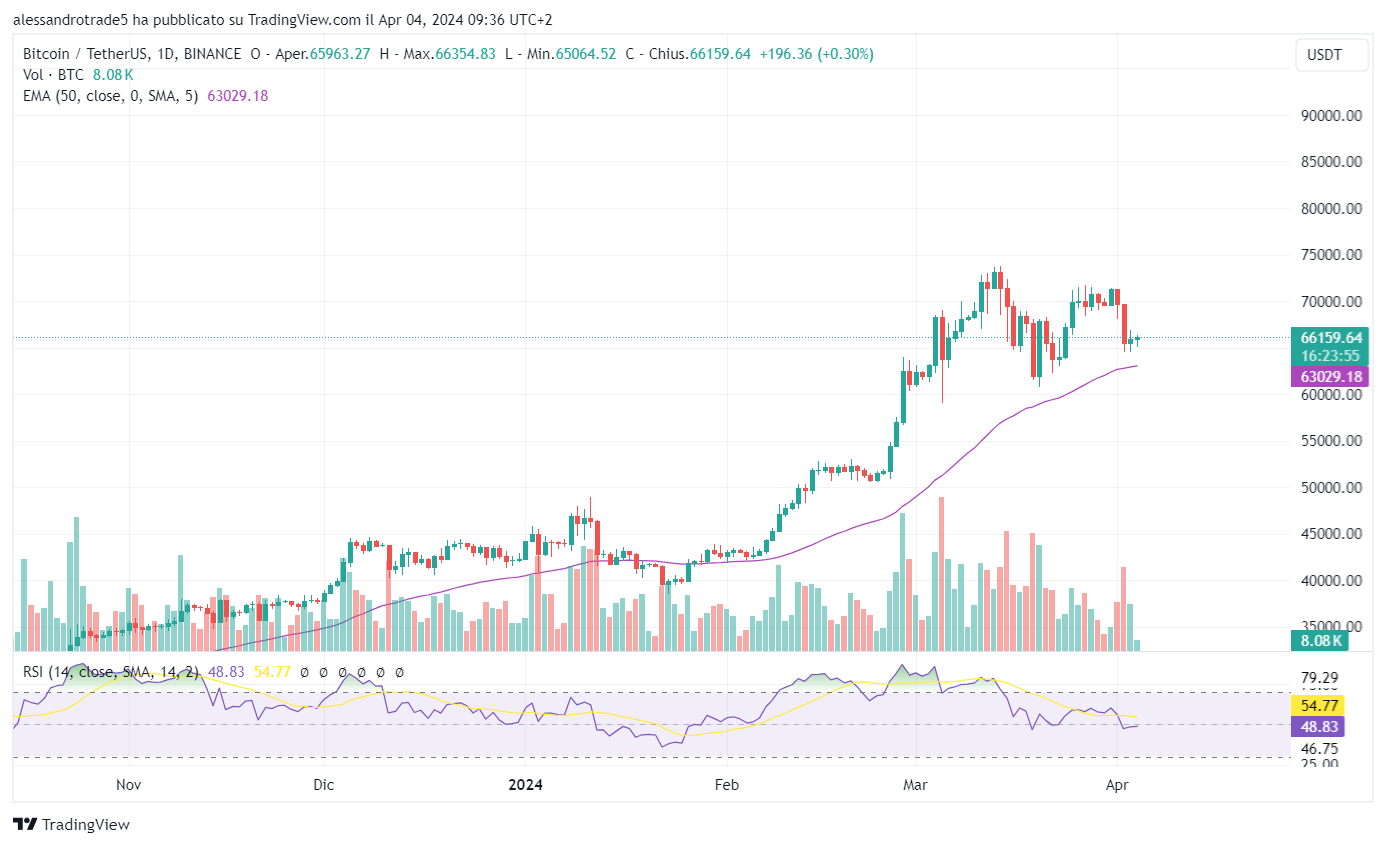
Immediately after reaching new all-time highs at 73,650 USD, the largest cryptocurrency in terms of market capitalization started a downward correction phase, which brought it to be traded within the wide trading range of 71,000-62,000 USD.
The RSI daily, which had started a major uptrend since the beginning of February reaching overbought levels, has now dropped just below 50 points.
The indicator, which testifies the strength of a graphical trend, after the last Easter drawdown has returned to a neutral state and does not give us clear indications on the possible next moves of the cryptocurrency.
Anyway, it is interesting to observe how Bitcoin’s RSI recently reached values recorded just before the ETF inflows began to remove supply from the market pushing the price towards ambitious price ranges.
If Bitcoin were to bounce convincingly from here, we could expect a pattern similar to the one started in the early days of February, with a predominantly bullish trend.
Instead, if the bounce does not occur and digital gold remains trapped below the key level of 70,000 USD, another leg down in prices could occur with the RSI most likely visiting the 40 points zone.
Indicatively, the first stop in case of a bearish flush is around 63,000 USD, where the 50-period exponential moving average on the daily chart converges.
The next support, on the other hand, can be identified in areas just above $60,000 USD, where if the bullish activity is not enough to support the asset, a high volatility movement could occur with the lower limit set at $52,000 USD.
For now, neither of the two scenarios sees a greater probability of materializing, at least until we have an additional clue from the next price action of the asset, or until we integrate other data into the technical analysis.
It will be very interesting to observe how the volumes of the spot markets will move, decreasing in intensity from March onwards, in a context of also decreasing volumes of ETFs.
Data on Bitcoin ETF inflows on Wall Street
In order to have a more complete picture of the situation, let’s take a look at the latest data regarding the inflows of Bitcoin ETFs in the United States.
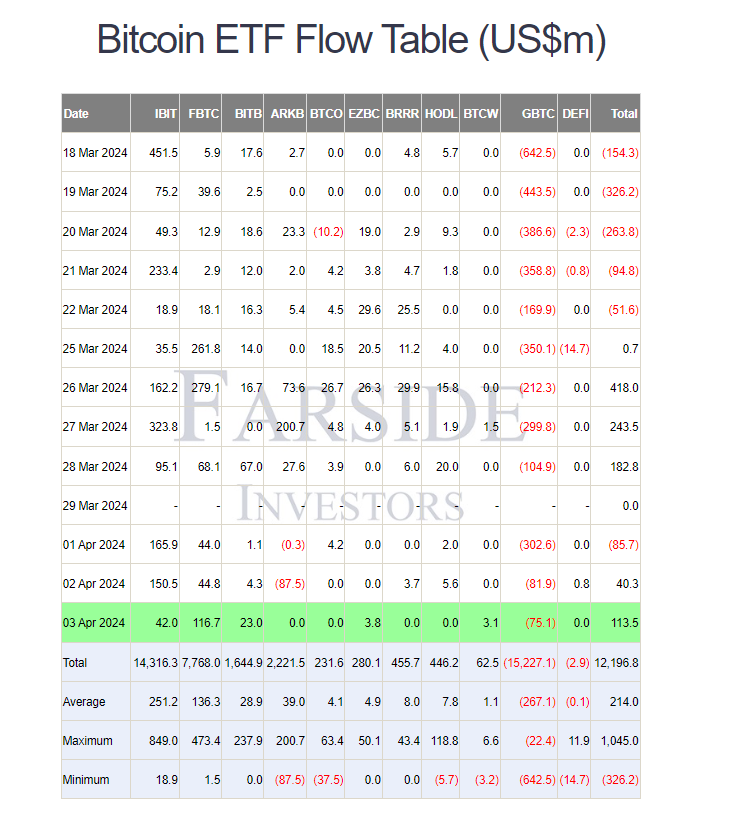
According to Farside, after the last week of March which had seen a recovery phase in terms of capital flows in regulated crypto exchanges, the activities of Fund Managers returned to record insignificant numbers in the first days of April.
In particular, Easter Monday was marked by sales with 85.7 million dollars leaving the market and GBTC continuing its distribution activity.
The following day we observed slightly positive flows of 40 million dollars, where this time the most aggressive seller was ARKB, which surprisingly surpassed GBTC for the first time since January.
Yesterday the data turned positive with an inflow of 113.5 million dollars, driven by purchases of FBTC, IBIT and BITB and countered by the usual sales of GBTC.
Overall, the picture of ETFs remains positive although more shaky compared to previous weeks where only inflow or outflow phases were observed.
Now, in fact, we begin to alternate days clearly positive with days in which outflows take over.
Anyway objectively so far the numbers have been extremely positive: since January we have recorded a total inflow of 12.19 billion dollars, with a daily average of 214 million dollars, a maximum positive daily of 1.04 billion dollars in inflow and a negative minimum of 326 million dollars outflow.
Now, in order for Bitcoin’s price action to once again aim for the $70,000 target, we must first hope that the data from today, Thursday, April 4th, and tomorrow show positive trading activity in terms of influences.
If instead even on Wall Street one prefers to sell their positions, we can already bet on a cryptocurrency price below $65,000 over the weekend, with bears aiming to push prices down to $60,000.
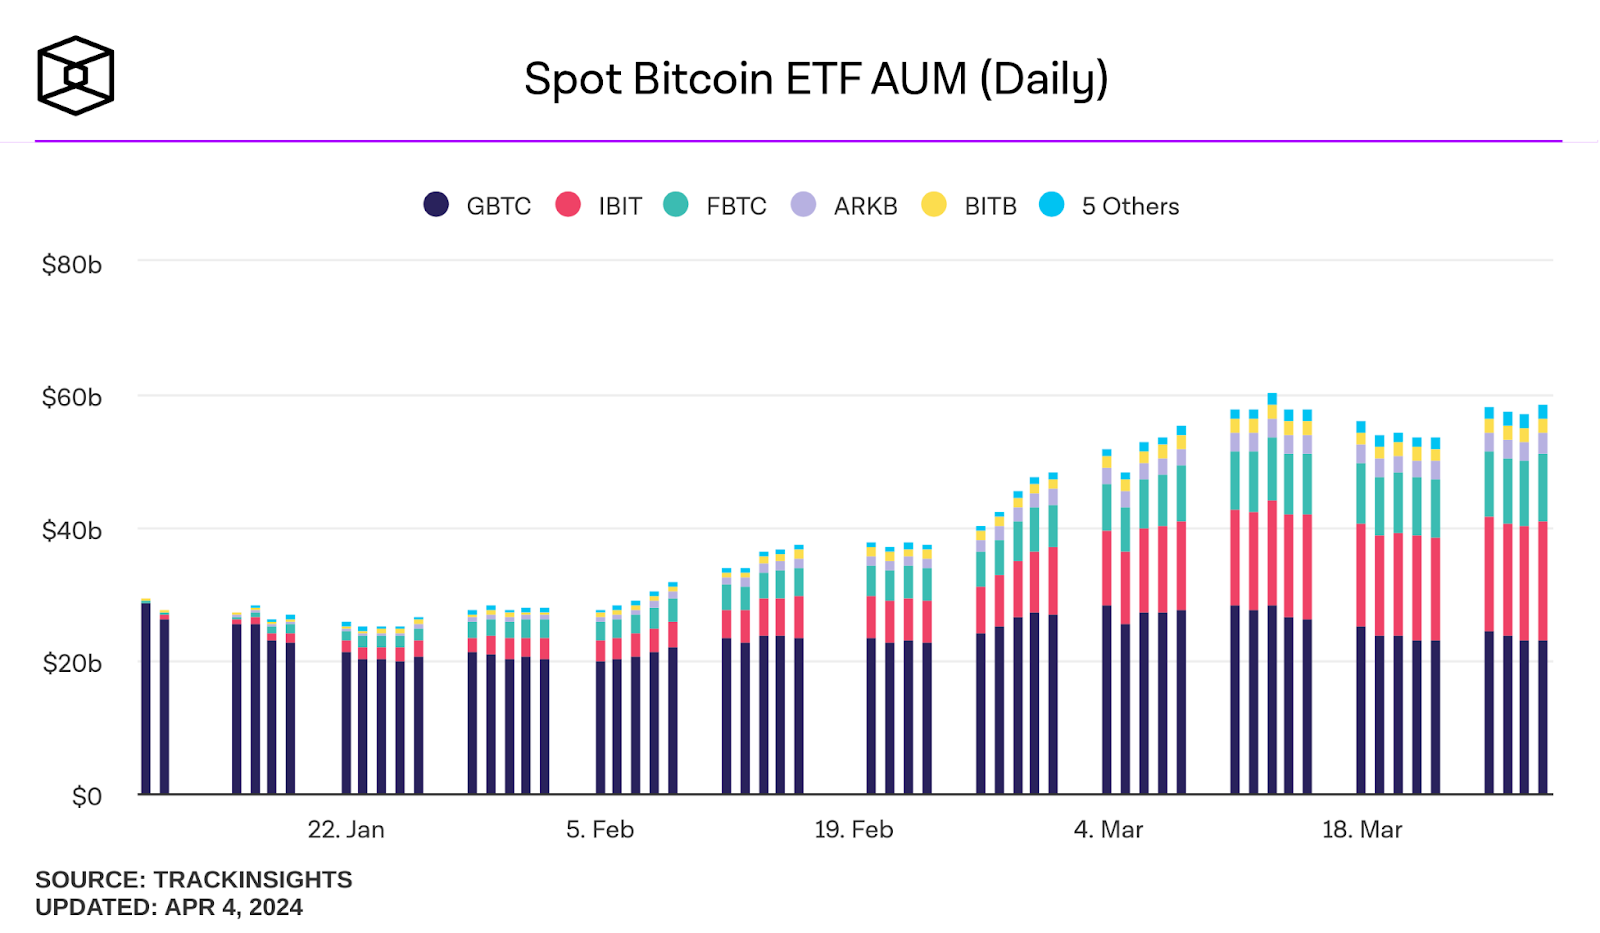
Very interesting in this context to observe how slowly the influence of Grayscale begins to be felt less, in favor of other competitors like BlackRock, Fidelity and Ark.
Soon we may see a less monopolized situation, where the sales of GBTC will no longer have the same negative impact as they do now.

