


At this moment the long-awaited altseason phase, in which most of the alternative coins record performances superior to those of Bitcoin, is at risk after a dangerous death cross appeared on the ETH/BTC chart on the weekly chart.
The downward crossing of the 50-period simple moving average with the 200-period moving average generally indicates a downtrend in prices.
With ETH weaker than BTC, it will be difficult to see a positive reaction in the altcoin sector in the short term, however the altseason could be closer than the market expects.
All the details below.
Summary
Deathcross on the weekly chart ETH/BTC puts at risk the altseason phase of the bullish market
While Bitcoin travels indecisively within the trading range of 62,000-71,000 USD, Ethereum moves with less conviction marking a worse graphic performance compared to the first cryptocurrency by market capitalization, and diminishing the hopes of retail investors to enter altseason in the near future.
Generally, in fact, the phase in which alternative coins mark monstrous value increases outperforming the digital gold, begins when the ETH/BTC chart shows signs of strong upward movement during the bull market.
Today, looking at this chart on a weekly time frame we can notice a predominantly bearish trend of prices, with the simple moving average of 50 periods crossing downwards that of 200 periods.
Technically known as “death cross” this condition usually ends up generating a decline in prices, signaling the start of a potential prolonged underperformance cycle of ether and other altcoins compared to bitcoin.
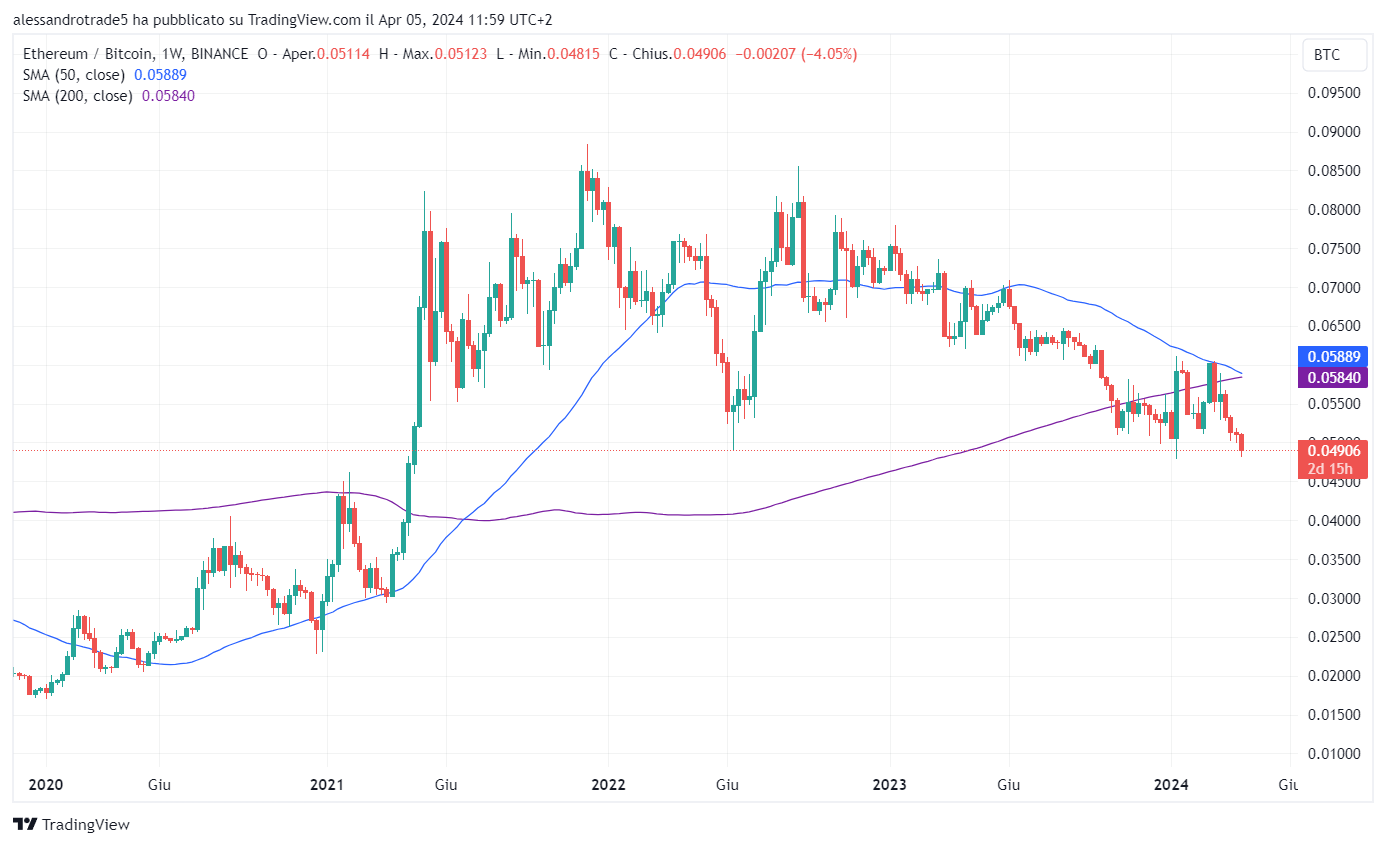
In the last few weeks of trading, market indecision has led ETH to record 5 red candles out of 6, after the currency had tried to attack the 0.06 sat zone but was rejected by bitcoiners.
Now the loss of 0.05 sat could set the stage for further downward price flushing with the next support in the 0.04 sat area.
The difficult situation for ether is also confirmed by analysts from the company QCP Capital, based in Singapore, who stated in a recent market note:
“The ETHBTC cross is testing a critical support level after dropping below 0.05. There has been a significant and persistent selling of ETH call options that has crushed [volatility] and also exerted some downward pressure on the price. It could once again be a very early signal of a FOMO [bullish] turning into fear in ETH as a proxy for alternatives.”
With the ETH/BTC ratio already down 10% since the beginning of the year, retail traders are starting to stop dreaming of an imminent altseason in the market, making room for different scenarios.
However, the bullish reaction of ETH could be closer than we think: the cryptocurrency is approaching a support zone that in June 2022 managed to keep prices high, so it could also prove to be good this time.
Furthermore, the ETH/BTC pair has been registering a continuous downtrend since September 2022, when each ether was worth 0.08 BTC: the bulls could soon take control of the situation again after such a long distribution period.
History teaches us that when fear spreads through the streets, it is the ideal time to do business: if the dip in ether is absorbed, the chances of an altseason by the beginning of summer could revive.
Bitcoin dominance still strong: too early for the altcoin golden moment, but memecoins are already showing excellent performance
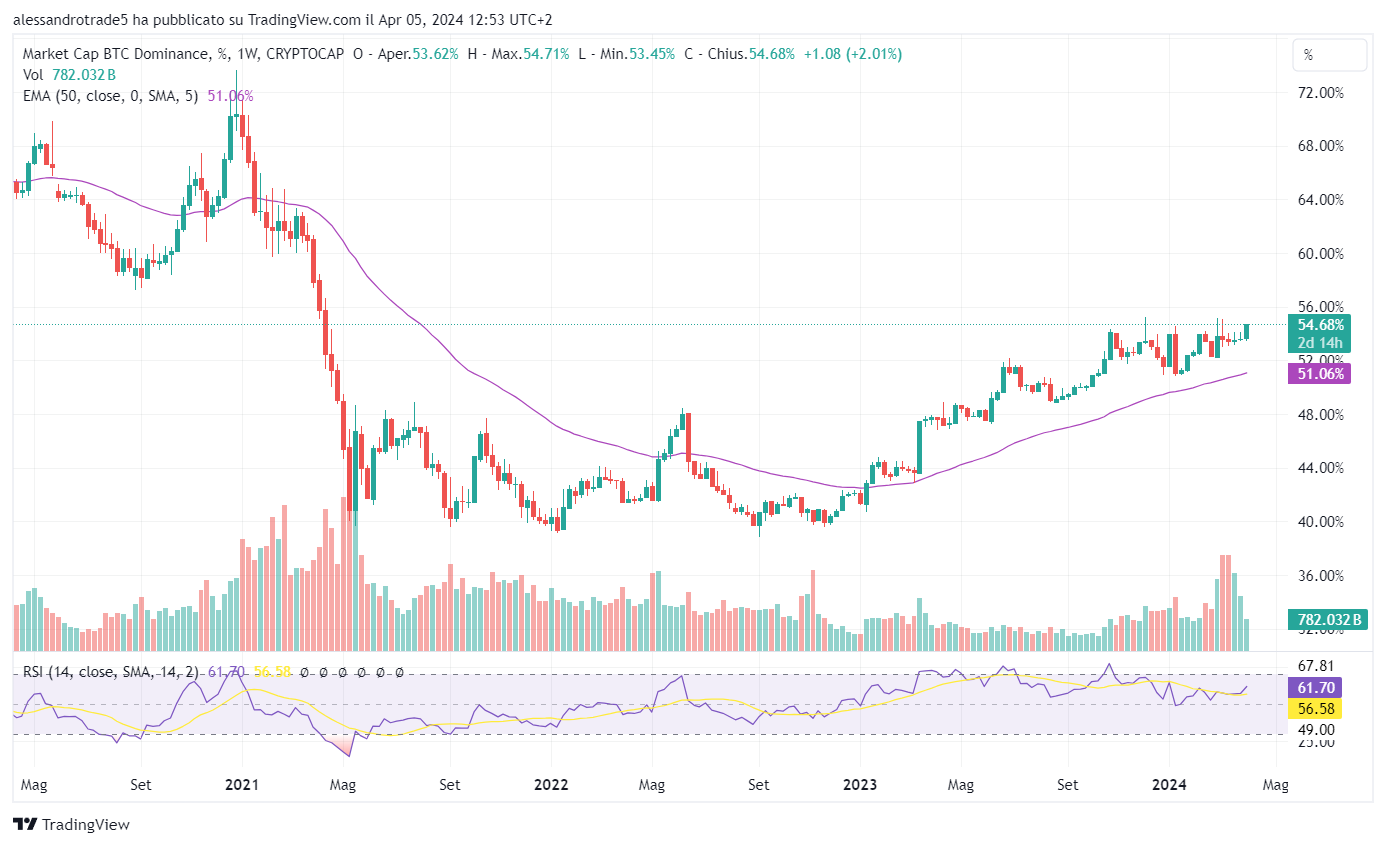
Another very important chart to observe in order to understand when the long-awaited altseason phase will begin is the dominance chart of Bitcoin (BTC.DOM)
This chart shows the dominance rate, expressed in terms of market capitalization, of Bitcoin compared to the rest of the altcoin world.
Indicatively, the altseason begins when, within a generally bullish market phase, BTC loses market share compared to competing coins
Here too we can observe a situation that does not bode well for the arrival of an altseason, with BTC.DOM continuing its bullish rally since November 2022, bringing dominance to 54.68%.
It might be too early to shout about the rise of the entire altcoin sector, at least until we see the first signs of weakness in the chart just presented.
A first breakdown of 53% value, followed by a bearish continuation below 50%, could open the doors to a new market phase led by ETH and smaller cryptocurrencies.
For now, there are no encouraging signs in this sense, even though within the niche memecoin we observe a trend that seems to anticipate the arrival of the altseason.
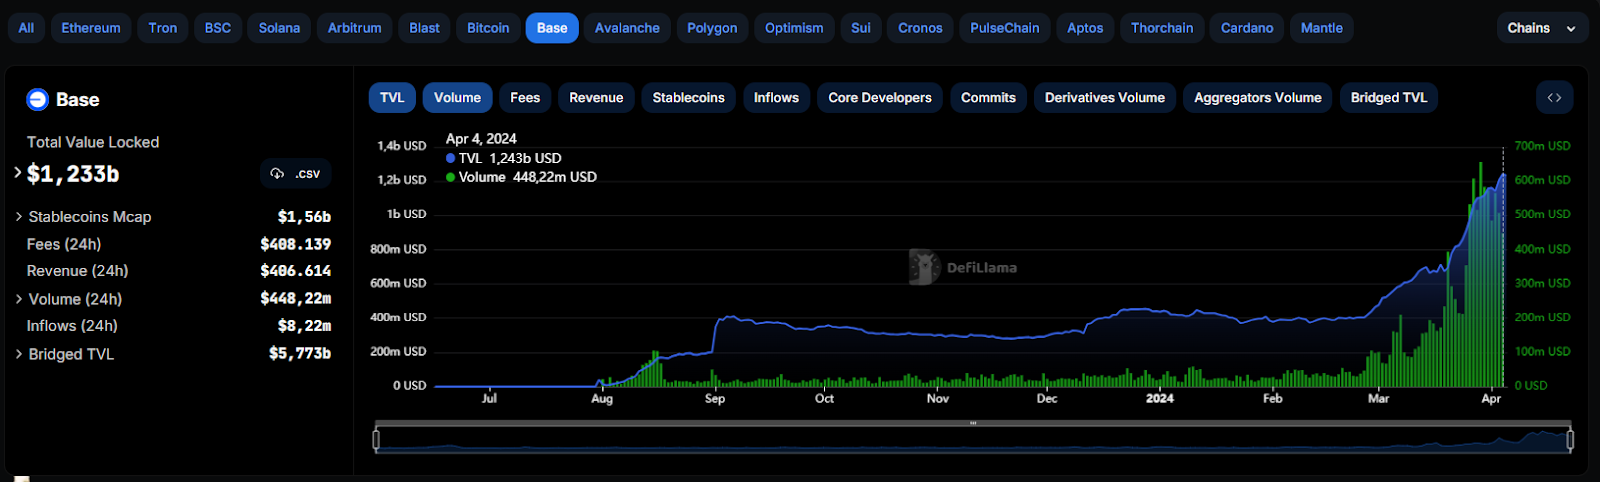
In the Solana and Base blockchains, we notice a strong speculative activity on meme-based cryptos, which indicatively demonstrate the traders’ willingness to expose themselves to riskier products than Bitcoin.
This could be seen as a prelude to an even more aggressive phase, in which memes and low cap tokens could be targeted by the degens of the crypto world, abandoning bitcoin as the most attention-grabbing asset to make room for other alternatives.
To give an idea of how strong this memecoin mania is, we report the data from DefiLlama which shows a volume increase of about 10 times on the Base blockchain from February to today, from 50 million dollars per day to the current 500 million.

