




Traders are watching Ethereum price today as it grinds higher intraday while still dealing with a structurally damaged higher timeframe chart and fearful sentiment.
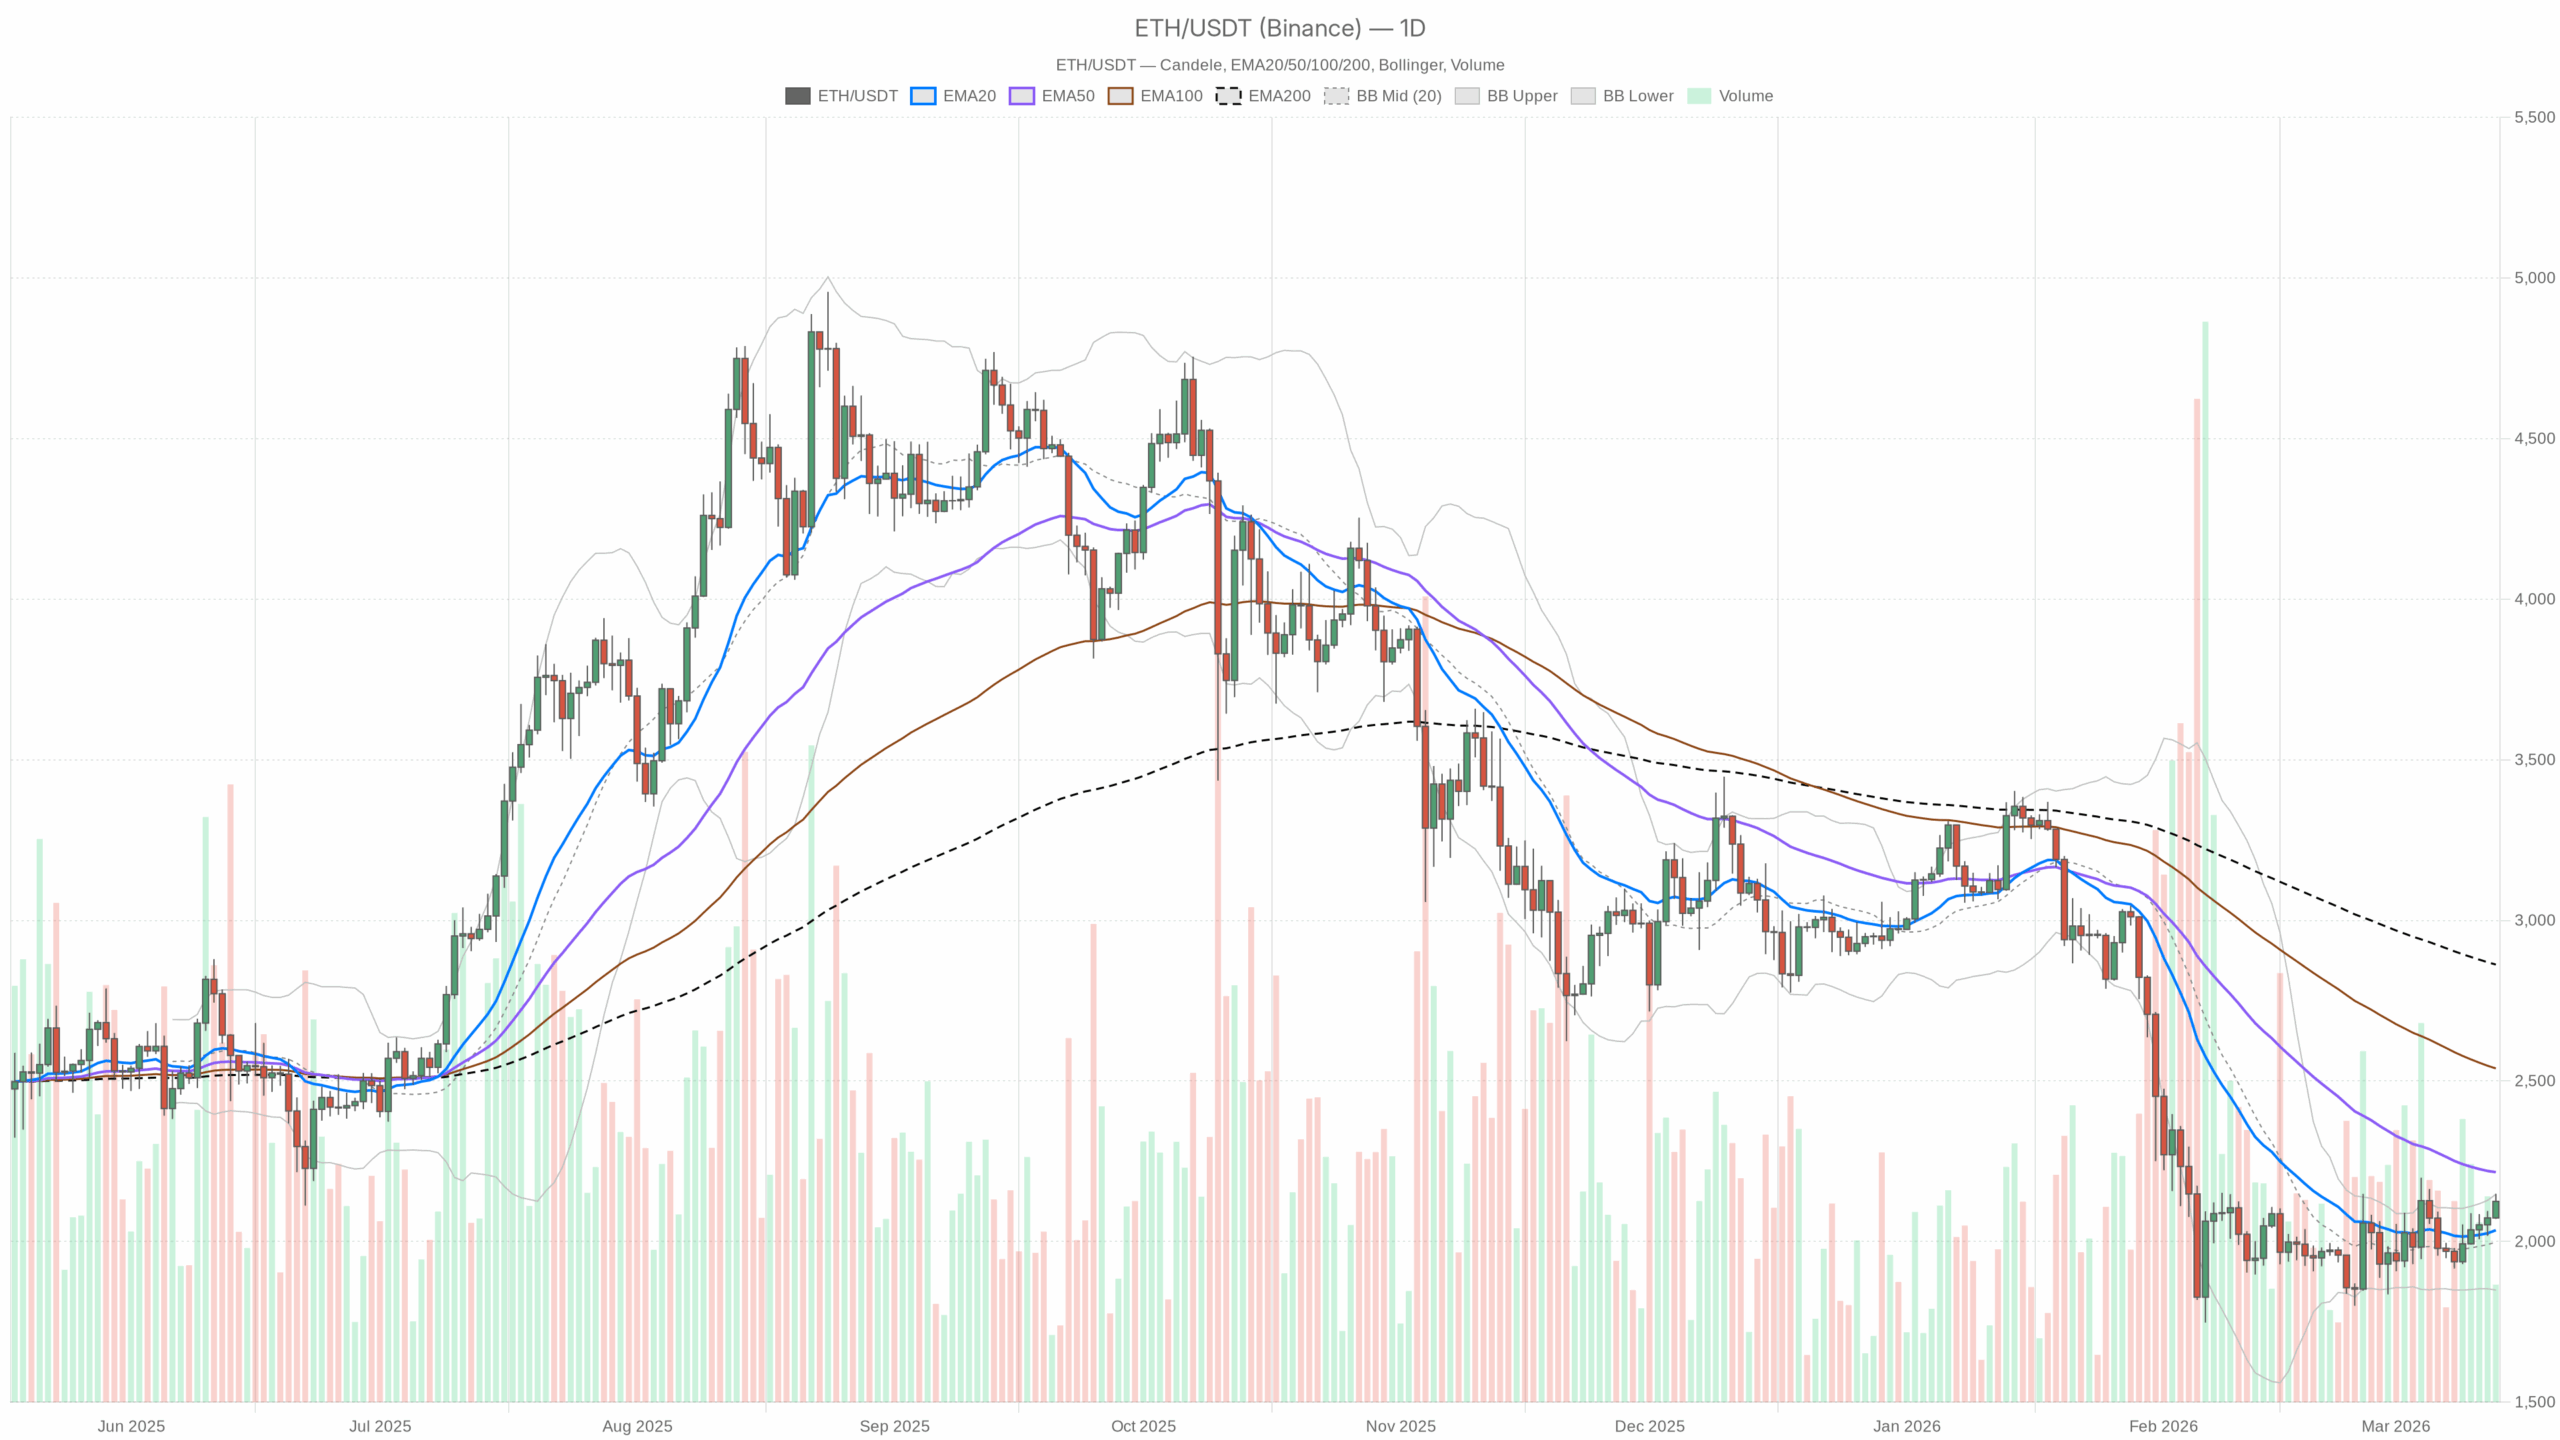 ETH/USDT daily chart with EMA20, EMA50 and volume”
loading=”lazy” />
Summary
Daily chart (D1): macro bias – cautiously constructive, not a clean uptrend
Trend structure and EMAs
On the daily, ETH closes at $2,125.01:
- Price vs EMAs: price is above the 20‑day EMA at $2,035.19, but below the 50‑day EMA at $2,215.99 and far below the 200‑day EMA at $2,862.23.
This is classic mid-cycle repair territory. Regaining the 20‑day EMA shows the aggressive shorts are backing off and dip buyers are active. However, trading below the 50‑ and 200‑day EMAs means the larger downtrend, or at least a major corrective phase, is still in play. Bulls are working from a position of weakness, not strength.
RSI: momentum back to balance
The daily RSI is 54.37.
Momentum has swung back to neutral-to-slightly-positive. The market is no longer in panic-selling territory, but it is also nowhere near overbought. This lines up with a market stabilising after fear, not one that has convincingly broken into a new leg higher.
MACD: early bullish turn, but against a damaged backdrop
Daily MACD line: -23.34, signal: -54.68, histogram: +31.33.
The MACD is still below zero but curling higher with a positive histogram. That is what you see in the early stages of a potential trend reversal or a strong counter-trend rally. In plain language, the selling pressure that dominated recently has faded, and buyers are gaining the upper hand. Yet the move is still unfolding under the zero line, so it is a repair rally, not a confirmed bull trend.
Bollinger Bands: bounce off the mid, flirting with upper band
Daily Bollinger Bands (20,2): mid $1,998.05, upper $2,147.15, lower $1,848.94. Price is at $2,125, close to the upper band.
ETH has reclaimed the mid-band and is now pressing into the upper half of the volatility envelope. That typically reflects a shift in control from sellers to buyers on this timeframe. However, sitting this close to the upper band can also precede short-term exhaustion if follow-through volume does not show up.
ATR: volatility is elevated but not extreme
The daily ATR(14) sits at $117.59.
That is a reasonably wide daily range in dollar terms, consistent with a market still digesting recent swings. It is not a capitulation spike, but it shows risk per trade is higher than in quiet, grinding markets. Position sizing needs to respect that.
Daily pivot levels: current inflection zone
Daily pivot set:
- Pivot (PP): $2,114.64
- First resistance (R1): $2,159.17
- First support (S1): $2,080.49
Price is trading just above the pivot and beneath R1, which makes this area a live battleground. Holding above the pivot tilts the day in favour of the bulls. In contrast, repeated rejections at R1 or a slip back below the pivot would show the bounce is running out of steam.
Daily takeaway: The main scenario on D1 is neutral with a bullish tilt. Short-term momentum supports further upside, but structurally ETH has not done enough to shift the longer-term downtrend or deep corrective phase.
Hourly chart (H1): intraday trend is bullish
Trend and EMAs: clean upside alignment
On the 1‑hour chart, ETH is at $2,125.72 with:
- 20‑EMA: $2,096.85
- 50‑EMA: $2,073.62
- 200‑EMA: $2,034.45
Price is trading comfortably above all three, with the EMAs stacked in classic bullish order (price > 20 > 50 > 200). That is a straightforward intraday uptrend: buyers are defending pullbacks, and dips into the 20‑EMA zone intraday are being bought.
RSI and MACD: momentum in buyers’ hands
The hourly RSI is 64.48.
Momentum is firmly on the bullish side but not yet at blow-off levels. This is compatible with a steady grind higher, where each small dip finds support rather than immediate rejection.
Hourly MACD shows a line at 16.16, signal at 14.53, and a small positive histogram of 1.63.
Here, MACD is above zero with a modest positive spread. This confirms that the intraday trend is already in positive territory, not just bouncing from oversold levels. The slightly narrowing histogram hints that the pace of the move is cooling a bit, so while the trend is up, it is not accelerating aggressively.
Bollinger Bands and ATR: controlled intraday grind
Hourly Bollinger Bands: mid $2,093.13, upper $2,144.44, lower $2,041.82. Price at $2,125.72 is in the upper half of the band.
Trading in the upper band region signals a persistent buy-the-dip tone on this timeframe. ETH is not hugging the band in a parabolic fashion, which matches the idea of a controlled, orderly advance rather than a blow-off spike.
The hourly ATR(14) is $22.41.
That reflects healthy intraday volatility without being chaotic. Range traders can work with it, but tight stops near obvious levels are likely to get shaken out.
Hourly pivot levels: micro structure
On H1, the current pivot levels are:
- Pivot (PP): $2,126.50
- R1: $2,128.52
- S1: $2,123.71
Price is oscillating around the hourly pivot, just below R1. This is a classic consolidation just under intraday resistance. A sustained push and hold above R1 would typically open the way to further upside. Conversely, repeated failures here often mark the start of a short-term pullback toward the 20‑EMA region.
15‑minute chart (M15): execution layer – strong but stretched
Short-term trend and EMAs
On the 15‑minute chart, ETH trades at $2,127.09 with:
- 20‑EMA: $2,112.99
- 50‑EMA: $2,103.22
- 200‑EMA: $2,074.84
Again, price is well above all EMAs, and they are aligned in a strong bullish stack. The short-term trend is decisively up; bears have no control on this timeframe right now.
RSI and MACD: momentum nearing a hot zone
The 15‑minute RSI stands at 65.66.
This is a hot but not yet overheated reading. In practice, it often means the market can push a bit higher but is vulnerable to quick intraday shakeouts as late buyers chase strength.
MACD on M15: line 6.15, signal 3.47, histogram 2.68.
The MACD is firmly above zero with a positive, widening histogram. That is short-term buying pressure in full control. On a 15‑minute basis, this is the kind of momentum cluster that can fuel one more push higher, but if it stalls, it can flip into a fast mean-reversion move back toward the 20‑EMA.
Bollinger Bands and ATR: near the top of the short-term range
15‑minute Bollinger Bands: mid $2,107.38, upper $2,131.30, lower $2,083.46. Price is at $2,127.09, just under the upper band.
Trading this close to the upper band on a short timeframe shows strong immediate demand, but it also means the local risk-reward for fresh longs is getting worse. Chasing at the top of the band is usually a late-entry behaviour.
The 15‑minute ATR(14) is $9.32.
That is enough intraday noise to regularly test nearby support levels, even in an uptrend. Tight, emotional stops are not likely to survive the swings.
15‑minute pivot: immediate inflection
Current M15 pivot levels:
- Pivot (PP): $2,126.96
- R1: $2,129.43
- S1: $2,124.62
Price is sitting right on the pivot. That is a knife-edge intraday balance point: a clean push through R1 favours continuation of the micro uptrend. On the other hand, a slip back below the pivot and S1 would mark the start of a deeper intraday pullback toward the 20‑EMA.
Market context: fearful backdrop, ETH lagging BTC
Broader crypto market cap is about $2.54 trillion, up roughly 2.55% in 24 hours, with BTC dominance at 57.1%. The market is risk-on at the index level, as cap is rising and volumes are up over 15%. However, dominance this high shows most of that appetite is still flowing into Bitcoin.
ETH’s share of total market cap is just over 10%, which is historically low compared with periods when Ethereum leadership was stronger. Add to that a Fear & Greed Index at 15 (Extreme Fear), and you get an interesting mix: price bouncing, flows improving, but sentiment still heavily scarred. That is exactly the kind of tape where sharp, counter-trend rallies can emerge, but also where confidence can evaporate quickly on bad news.
On the DeFi side, Uniswap V3 fees are up over 640% day-on-day, with other major DEXs like Curve also posting large fee jumps. That points to a spike in on-chain trading activity. More activity on Ethereum-based DEXs is often a tailwind for ETH demand through gas usage and rotation trades, but it can also coincide with hedging and deleveraging. Net-net, it confirms that this is an active, not sleepy, environment for ETH.
Main scenario for Ethereum price today: neutral on daily, bullish intraday
Putting it all together, the main scenario is:
Daily bias: Neutral with a constructive tilt – price is back above the 20‑day EMA, momentum has normalised, and MACD is turning up, but ETH is still capped by the 50‑day and deeply below the 200‑day EMA.
Intraday bias (H1 & M15): Clearly bullish – EMAs are positively stacked, RSI and MACD both favour buyers, and price is holding in the upper halves of the Bollinger Bands.
This creates a typical tension: short-term traders see a buy-the-dip market, while longer-term participants still see a damaged chart that has not repaired its key moving averages.
Bulish scenario: repair continues above key resistance
In the bullish path for Ethereum price today, the intraday uptrend extends and starts to drag the daily chart into a more clearly positive stance.
For that scenario to develop:
- On the 15‑minute chart, ETH holds above the pivot at $2,126.96 and converts R1 at $2,129.43 into an intraday floor. Dips toward the 20‑EMA around $2,113 get bought quickly.
- On the hourly, price sustains above the 20‑EMA (around $2,097) and makes a clean move through the local band highs near $2,145–2,150 in the hourly upper Bollinger band region.
- On the daily, ETH spends more time above the pivot near $2,114.64 than below it and challenges or reclaims the daily R1 at $2,159.17. A close pushing into or above the $2,160–2,200 zone would mark a solid step toward retesting the 50‑day EMA at $2,215.99.
If this plays out, RSI on the lower timeframes likely stays elevated without spiking into extreme overbought territory, while the daily RSI creeps into the 60s. MACD on D1 would keep rising toward the zero line. That is the kind of profile you see when a short-covering rally transitions into something more durable.
What would invalidate the bullish scenario?
This intraday bull case breaks if ETH loses its short-term trend structure:
- A decisive drop below the hourly 20‑EMA (around $2,097) that is not bought, followed by a test and failure of the 50‑EMA at $2,073.62, would be the first serious warning.
- On the daily, a close back below the 20‑day EMA at $2,035.19 would show the repair has failed and bears have regained the upper hand.
- If daily RSI rolls over from the mid‑50s and sinks back toward the 40s while MACD’s histogram shrinks and flips negative, the bullish repair narrative is essentially dead for now.
Bearish scenario: failed bounce and return to lower range
The bearish path assumes this is just a counter-trend bounce in a still-dominant larger downtrend. ETH would roll over from current levels and start to retest deeper supports.
For that to unfold:
- On the 15‑minute chart, price fails to hold the pivot at $2,126.96, breaks below S1 at $2,124.62, and loses the 20‑EMA at $2,112.99, with the 50‑EMA at $2,103.22 no longer catching dips.
- On the hourly, ETH falls through the pivot at $2,126.50, then through S1 at $2,123.71, and eventually through the 20‑EMA and 50‑EMA, turning them into resistance.
- On the daily, price closes back inside or below the Bollinger mid-band at $1,998.05 and moves toward the S1 daily support at $2,080.49 first, then the band mid and potentially lower toward the lower band at $1,848.94 if selling accelerates.
In that case, daily RSI would likely slip back under 50, and the MACD histogram would start contracting or turn negative, revealing that the bounce was just a pause in a broader down move. Given the prevailing Extreme Fear, such a rollover could become quite sharp if late longs are forced to exit.
What would invalidate the bearish scenario?
The bear case weakens significantly if ETH keeps defending key moving averages and starts taking back major resistance:
- Repeated defence of the hourly 50‑EMA (around $2,074) with higher lows on intraday charts undermines the idea of an imminent breakdown.
- A daily close above the 50‑day EMA at $2,215.99, with RSI holding above 55–60, would strongly argue that the market has shifted from a dead‑cat bounce into a more sustained trend repair.
- If MACD on D1 continues to rise and crosses above zero while price holds above the 20‑ and 50‑day EMAs, the bearish medium-term narrative is effectively invalidated.
How to think about positioning, risk, and uncertainty
Ethereum price today sits at the crossroads of fearful sentiment and improving short-term structure. Intraday traders are dealing with a textbook bullish trend: price above EMAs on H1 and M15, strong momentum, and support from the upper halves of the Bollinger Bands. Higher timeframe traders, however, are still looking at a chart trading below the 50‑ and 200‑day EMAs in a risk-off macro backdrop driven by Bitcoin dominance.
Volatility, measured by ATR on both daily and intraday charts, is elevated enough that risk management matters more than usual. Levels like the daily pivot at $2,114.64, daily R1 at $2,159.17, and the nearby EMA clusters are the real lines in the sand for today’s session. Breaks and retests around those levels will likely define whether this bounce extends or fails.
In a market running on Extreme Fear, the biggest risk is overconfidence in either direction. Short-term strength can flip quickly if macro headlines or BTC flows turn, while longer-term pessimism can be punished if this repair rally evolves into a full trend reversal. Staying aware of which timeframe you are trading, and respecting the ATR-implied risk on that timeframe, is more important today than picking a side for the next few weeks.
