




Market conditions are sending mixed signals, with the XRP price showing short-term strength even as the broader structure remains under repair across higher timeframes.
Summary
Main Scenario from D1: Cautiously Bullish, Structurally Rebuilding
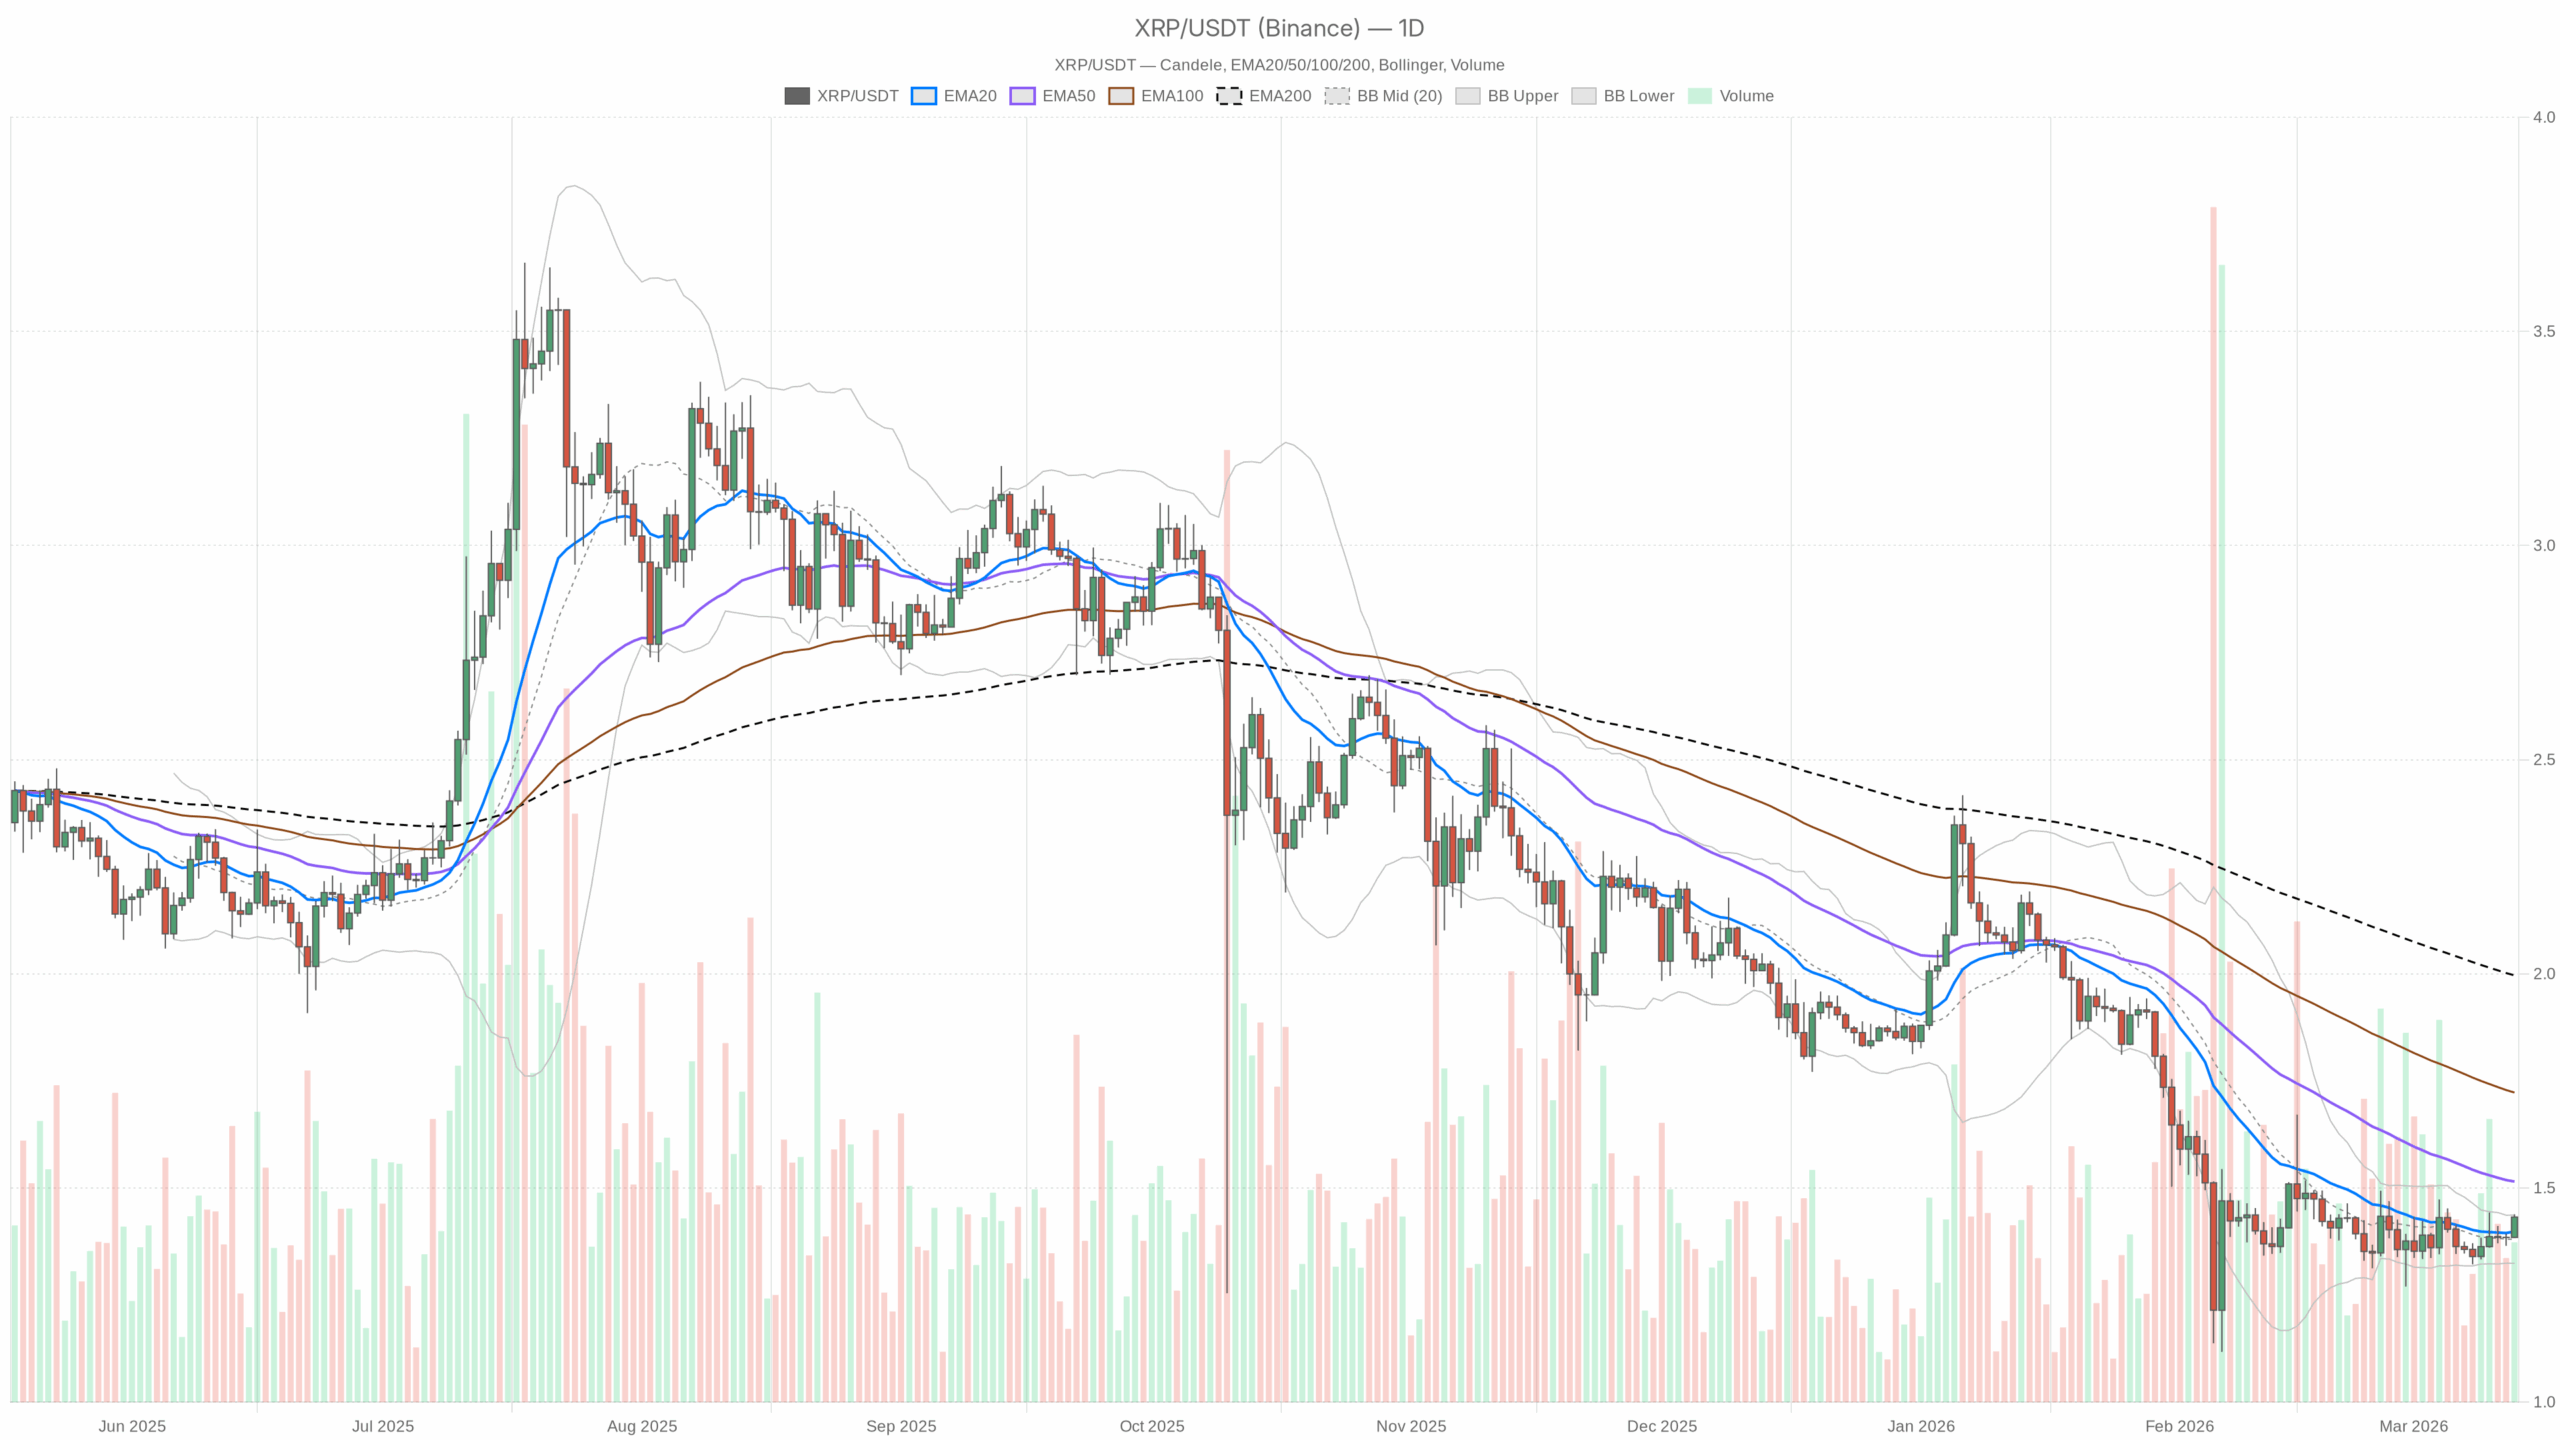
The XRP price against USDT is sitting at $1.43, right on top of a key daily pivot at 1.42–1.43 and hugging the upper edge of its recent range. The broader crypto market is recovering (total market cap up ~2.5% in 24h), but sentiment is still deeply shaken: the Fear & Greed index sits in Extreme Fear (15). That combination usually creates asymmetric setups: good bounces, but fragile conviction.
On the daily chart, XRP is no longer in full-blown downtrend, but it is not in a healthy bull trend either. Price is poking above short-term averages while still trading well below the heavier, longer EMAs. In other words, this is a counter-trend recovery inside a damaged higher timeframe structure. The hourly and 15‑minute charts, however, are decisively bullish, showing strong intraday demand and low realized volatility. The dominant force right now is short-term dip-buying trying to repair a medium-term technical breakdown.
Based on the daily timeframe, the main scenario is cautiously bullish in the short term but still structurally fragile. XRP is trying to build a base above the 20‑day EMA and daily pivot, but the 50‑day and 200‑day EMAs above price remind us that this is more of a recovery phase than a clean uptrend.
Daily Chart (D1): Structure and Risk Context
Trend & EMAs (D1)
– Close: 1.43
– EMA 20: 1.40
– EMA 50: 1.52
– EMA 200: 2.00
XRP is trading above the 20‑day EMA (short-term positive), but still below both the 50‑day and 200‑day EMAs. That is the textbook look of a market in a short-term bounce inside a broader corrective regime. Bulls have regained some control in the last few weeks, but they are still fighting against a larger overhead supply zone starting around 1.50 and stretching higher toward 2.00.
RSI (D1)
– RSI 14: 51.6
Daily RSI is perched just above 50, which fits a neutral-to-slightly-bullish stance. Momentum has recovered from prior weakness but has not flipped into strong trend mode. There is room for price to extend higher before any serious overbought concerns appear.
MACD (D1)
– MACD line: -0.03
– Signal line: -0.04
– Histogram: 0.01 (slightly positive)
MACD is still marginally negative but has turned up and crossed its signal from below, with a small positive histogram. That is consistent with an early or maturing recovery phase rather than a full-fledged downtrend. Bears are losing pressure, but bulls have not established a dominant macro impulse yet.
Bollinger Bands (D1)
– Middle band: 1.38
– Upper band: 1.44
– Lower band: 1.32
– Close: 1.43 (near upper band)
Price is trading very close to the upper daily band. That signals a short-term upside push within a relatively tight volatility envelope. XRP is not exploding higher; it is gliding along the upper edge of its recent range, which often marks controlled buying rather than capitulation short-covering.
ATR (D1)
– ATR 14: 0.07
With an ATR of 0.07 on a 1.43 price, daily realized volatility is moderate. Swings of roughly 5% per day are normal here. This supports the idea of a grinding recovery rather than a panic or blow-off phase.
Daily Pivot Levels (D1)
– Pivot (PP): 1.42
– Resistance 1 (R1): 1.45
– Support 1 (S1): 1.40
XRP is parked right on top of the daily pivot at 1.42–1.43. Immediate resistance is only a few cents away at 1.45, while first support is at 1.40. Holding above 1.40 keeps the short-term bull case intact. However, slipping back below the pivot would show that this push lacks follow-through.
Hourly (H1): Intraday Momentum is Clearly Bullish
Trend & EMAs (H1)
– Close: 1.43
– EMA 20: 1.41
– EMA 50: 1.40
– EMA 200: 1.38
– Regime: bullish
On the hourly chart, XRP is trading above all key EMAs, with a healthy, orderly stack (20 > 50 > 200). That is what a clean intraday uptrend looks like. Dips toward 1.40–1.41 are likely to attract buyers as long as this structure remains intact.
RSI (H1)
– RSI 14: 67.33
Hourly RSI is pressing into the high 60s, which signals strong short-term momentum and mild overheating. That often precedes either a brief consolidation or a shallow pullback rather than immediate trend reversal, especially when EMAs are still well aligned.
MACD (H1)
– MACD line: 0.01
– Signal line: 0.01
– Histogram: 0 (flat)
Hourly MACD is slightly positive but flattening. Momentum is still on the bulls’ side, but the impulse is not accelerating. This fits an intraday trend that is taking a breather right under resistance, rather than one that is about to launch into a vertical move.
Bollinger Bands (H1)
– Middle band: 1.40
– Upper band: 1.44
– Lower band: 1.36
– Close: 1.43
Price is again leaning towards the upper hourly band, echoing the daily picture: controlled upside pressure, not yet stretched into a volatility spike. As long as price rides the upper half of the bands while EMAs hold below, the intraday bias stays constructive.
ATR & Pivot (H1)
– ATR 14: 0.01
– Pivot (PP): 1.43 (R1 and S1 effectively the same here)
Hourly ATR at 0.01 shows a very tight intraday range. XRP is coiled around its hourly pivot at 1.43, which matches the daily pivot zone. That alignment of pivots across timeframes often marks an important decision level. Either price builds a base here for a push through 1.45, or buyers start to back away and volatility expands to the downside.
15-Minute (M15): Execution-Level Context
Trend & EMAs (M15)
– Close: 1.43
– EMA 20: 1.43
– EMA 50: 1.41
– EMA 200: 1.40
– Regime: bullish
The 15‑minute chart is aligned with the hourly: price is on top of the 20‑EMA and comfortably above the 50 and 200. That is intraday trend integrity. Any quick dips toward 1.41–1.42 that keep the EMAs stacked like this are more likely to be consolidation than distribution.
RSI & MACD (M15)
– RSI 14: 62.56
– MACD line: 0.01
– Signal line: 0.01
– Histogram: 0
On 15‑minute, RSI in the low 60s and a flat, slightly positive MACD describe steady, controlled buying. This is not a euphoric blow-off. It is more like persistent dip demand with no aggressive selling yet appearing.
Bollinger Bands & Pivot (M15)
– Middle band: 1.42
– Upper band: 1.44
– Lower band: 1.41
– Pivot (PP): 1.43
Price is oscillating in the upper half of the 15‑minute band structure, holding just above the pivot. Short-term traders are defending the 1.42 zone. However, losing that level intraday would be an early signal of waning momentum.
Market Context: Risk-Off Sentiment, Selective Strength
Bitcoin still dominates with ~57% market share, and the overall crypto market cap is climbing modestly with rising 24h volume. Yet the Extreme Fear read at 15 tells us positioning is cautious and liquidity can be thin on the wrong side. That favors mean-reversion and tactical trades over blind trend-chasing.
On the fundamental side, Ripple‘s $750 million share buyback at a $50 billion valuation is a clear vote of confidence from the company itself. That kind of corporate action does not mechanically move the XRP price, but it can support sentiment around the Ripple ecosystem and reduce the perceived tail risk around the project. It is a subtle but important backdrop for medium-term holders.
Bullish Scenario for XRP Price
In the bullish path, the intraday uptrend on H1 and M15 continues to pull the daily structure higher.
Key elements of the bullish case:
1. Hold above daily support: Price defends the 1.40–1.42 zone (D1 S1 and pivot), keeping XRP pinned above the 20‑day EMA at 1.40.
2. Break and sustain above 1.45: A clean, high-volume move through D1 R1 at 1.45, with price then using 1.45 as support on any pullback, would show that buyers are willing to chase above the current range.
3. Momentum follow-through: Daily RSI pushes toward the high 50s or low 60s and MACD deepens its turn upward, moving the MACD line clearly positive. That would confirm a shift from mere bounce to early trend.
If this plays out, the market could start targeting the 1.50–1.55 area first, near the 50‑day EMA at 1.52. Then it could potentially test the broader resistance zone stretching toward 1.70–1.80, where prior supply is likely waiting.
What invalidates the bullish scenario?
A decisive daily close back below 1.40, especially if accompanied by a roll-over in hourly EMAs (20 dropping below 50) and RSI sliding back under 50 on the daily. That would say the current move was just a short squeeze or a weak bounce rather than the start of a sustained advance.
Bearish Scenario for XRP Price
The bearish outcome leans on the higher timeframe damage. Price is still well under the 50‑day and 200‑day EMAs, meaning every rally runs into trapped longs and overhead supply.
Key elements of the bearish case:
1. Failure at 1.45: Price repeatedly wicks above 1.43–1.45 but cannot close strong above this band, signaling distribution at resistance.
2. Loss of intraday trend structure: On H1 and M15, the 20‑EMA crosses down through the 50‑EMA and price starts trading under both, turning former support zones (1.42–1.40) into resistance.
3. Shift in volatility: ATR on the hourly and daily begins to expand as price moves down, with daily RSI breaking back under 50 and MACD flattening or crossing bearish again.
In that scenario, the market likely retests the lower Bollinger area on D1 around 1.32–1.34. If fear remains elevated and the broader market stumbles, a deeper probe into prior swing lows below 1.30 would not be out of the question.
What invalidates the bearish scenario?
A sustained move where XRP clears and holds above 1.50–1.52, roughly the 50‑day EMA, with daily RSI firmly above 55–60. That would show that sellers at the 50‑day line have been absorbed and that the market is willing to price in a more constructive medium-term path.
How to Think About Positioning, Risk, and Uncertainty
This is not a clean, one-directional market. The daily chart says repair phase, while the intraday charts say active uptrend. That tension is exactly where traders can get chopped if they ignore timeframe alignment.
For now:
– The short-term edge favors the bulls as long as XRP holds above 1.40 and intraday EMAs remain stacked bullishly.
– The medium-term picture remains unresolved until price can reclaim and hold above the 50‑day EMA near 1.52.
– Overall market sentiment is still defensive, which means moves can reverse quickly when liquidity dries up.
From a risk perspective, the key is recognizing that volatility is moderate but not low. A normal daily swing is about 0.07, which on a 1.43 asset is material. In this type of environment, chasing breakouts right into nearby resistance, like 1.45, without a clear invalidation level is where traders typically donate capital.
Whether you lean bullish or bearish on the XRP price here should come down to timeframe. Short-term traders can work with the current intraday trend as long as 1.40 holds. Higher timeframe participants, though, will likely want to see XRP reclaim the 1.50s before upgrading this from promising rebound to durable uptrend. Uncertainty is still high, and the chart is telling you to respect both sides of the tape.
