




Speculative projects tied to PUMP.fun crypto like PUMPUSDT are moving against a nervous macro backdrop, where fear is high but risk appetite is still surfacing in pockets of the market.
Summary
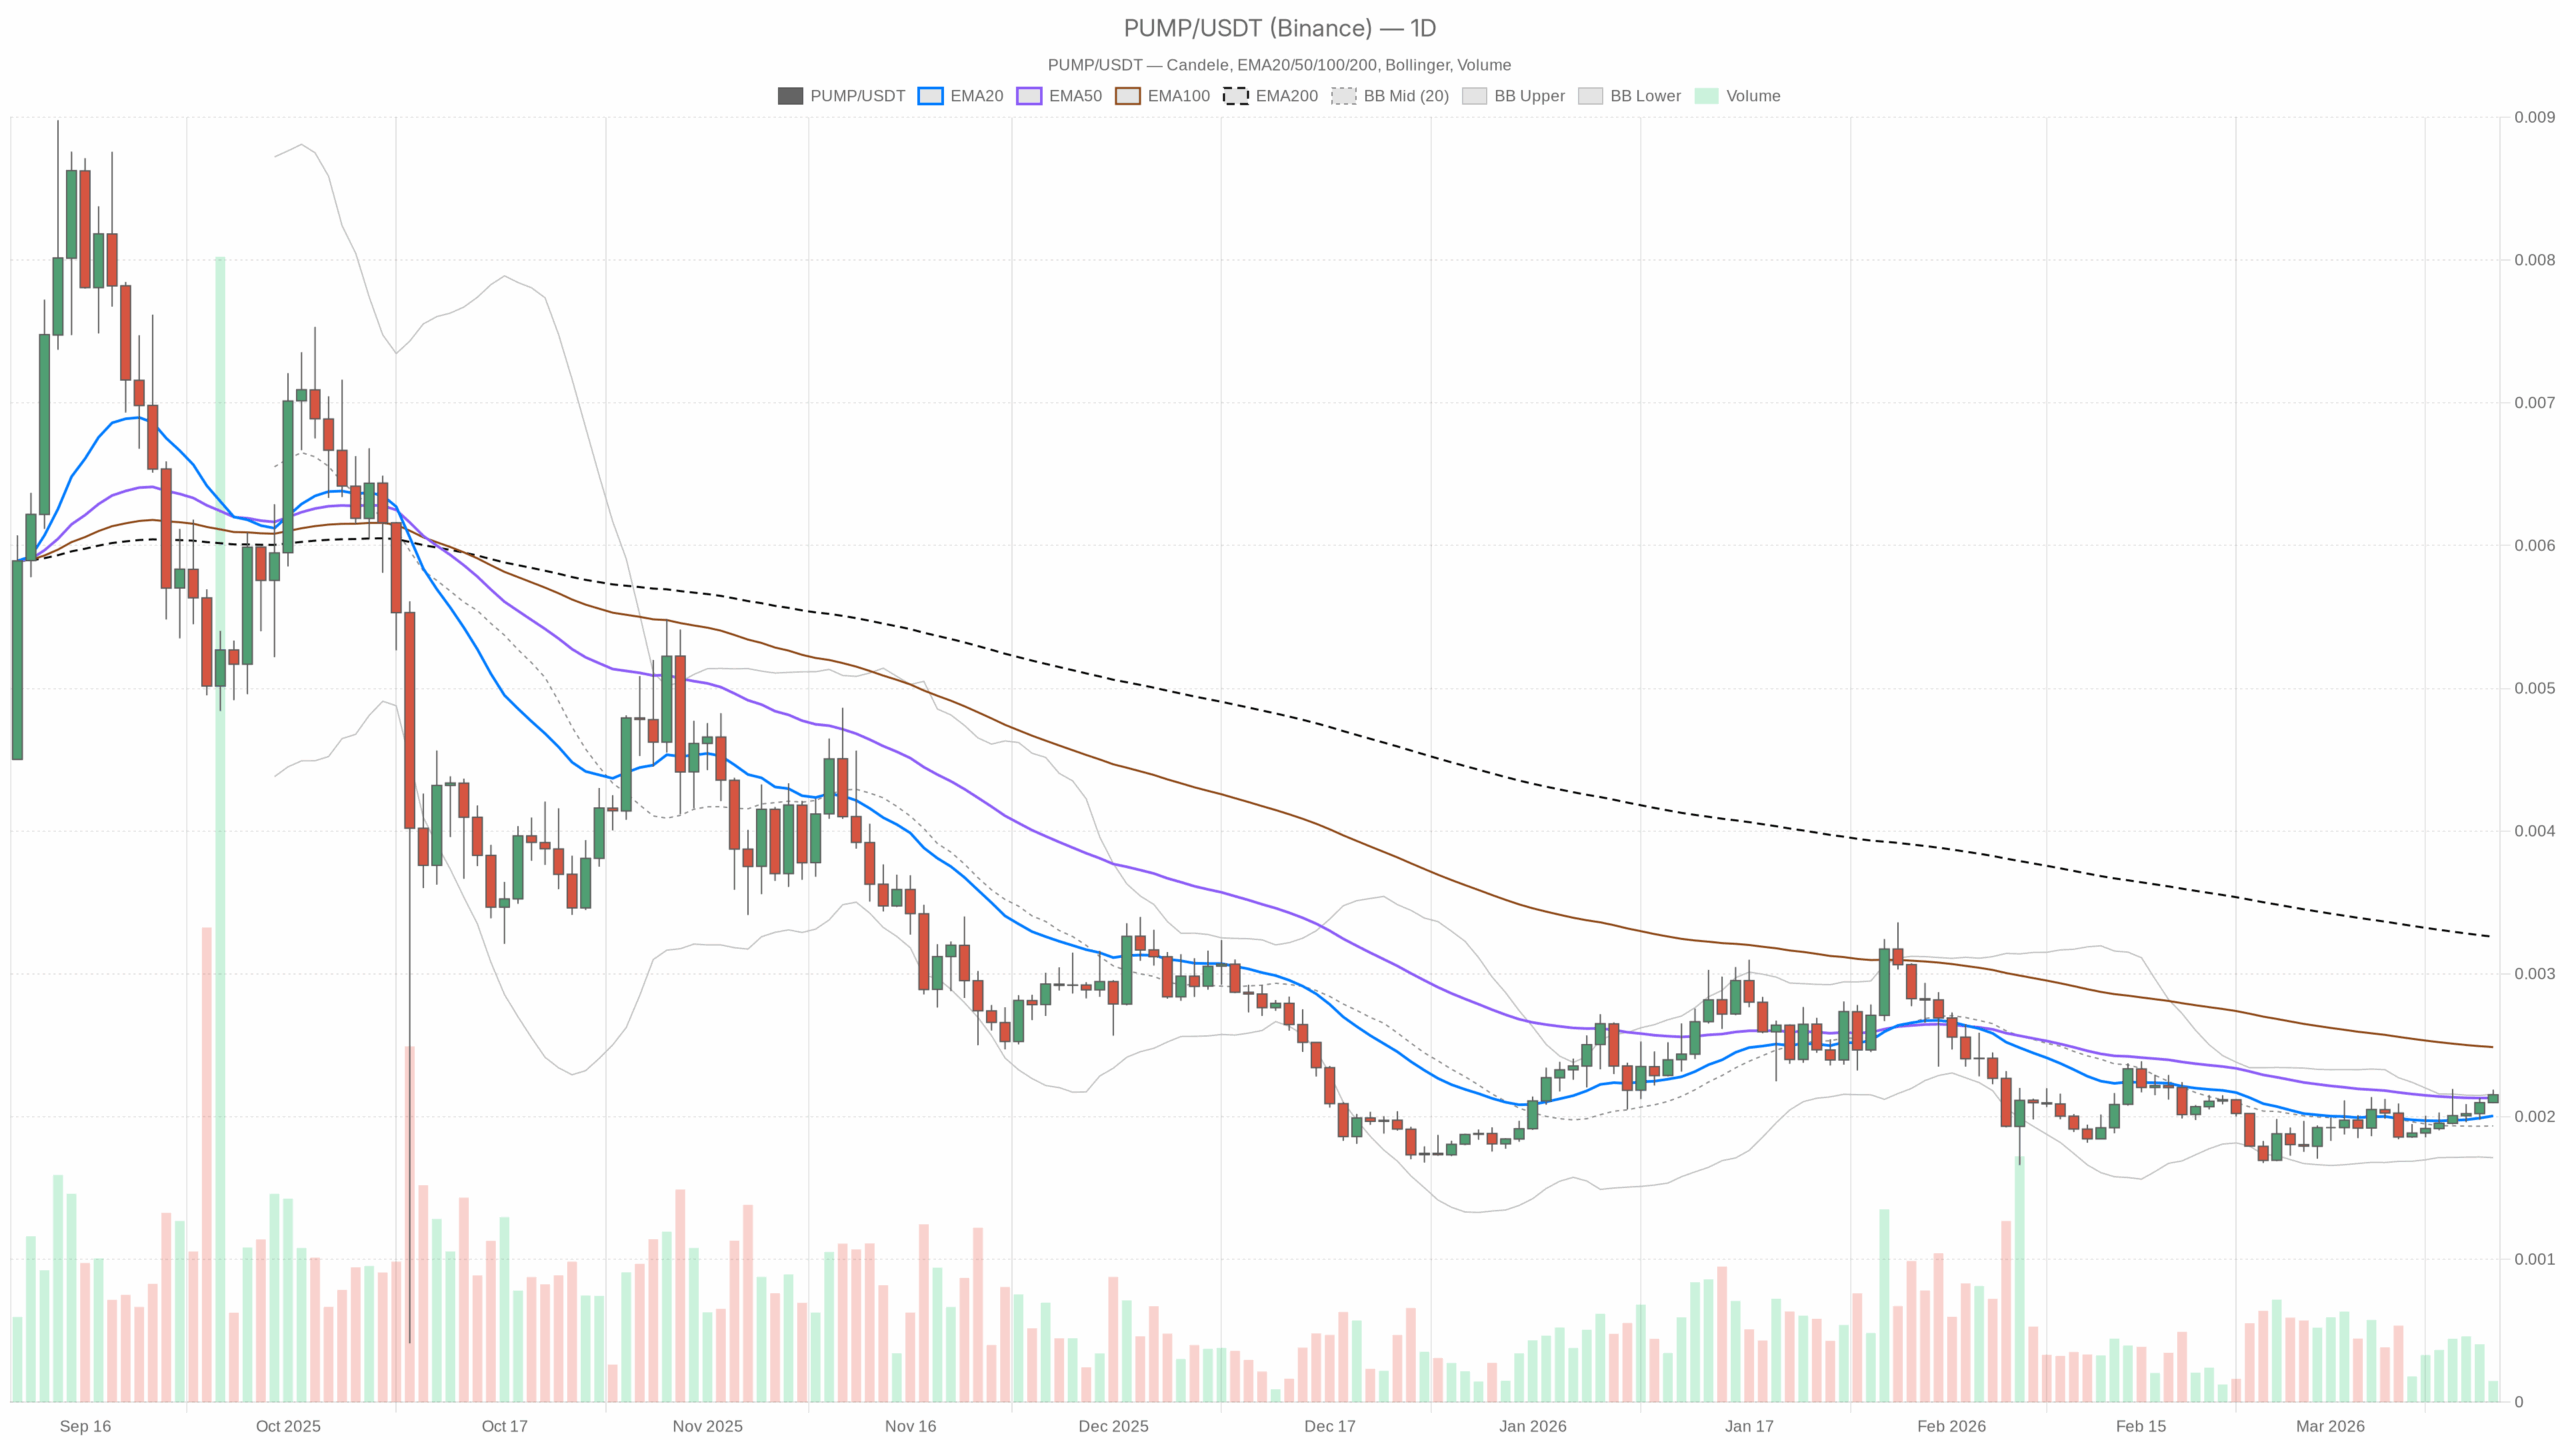
Daily Timeframe (D1): Neutral Bias With Room to Tilt Either Way
The broader crypto market cap is up about 2% on the day, BTC dominance is pushing 57%, and the Fear & Greed Index sits deep in Extreme Fear (15). That combination – rising cap, defensive BTC leadership, fearful sentiment – is classic late-downtrend or early-bottom behavior. It usually amplifies volatility in the meme and micro-cap corner where PUMP.fun operates.
With the daily regime on PUMPUSDT printing as neutral and intraday (H1 and M15) flashing bullish, the tape looks like it is trying to base out rather than trend aggressively. For a PUMP.fun style asset, that matters. Neutral daily structure plus rising intraday appetite is often the phase where sharp, narrative-driven spikes can erupt if liquidity concentrates on a handful of pairs. However, extreme fear and elevated BTC dominance tell you risk-on bursts can fade just as quickly.
The daily chart sets the strategic bias, and right now it is not giving a clean trend.
RSI (14-day): 56.39 – Mild Positive Momentum
RSI hovering just above the midpoint around 56 points to gently positive momentum without being anywhere near overbought territory.
How to read it: the market is not stretched in either direction. Buyers have a slight edge, but there is no clear exhaustion signal. This is the kind of RSI profile where the next directional push can still be meaningful. It has not been “used up” yet.
MACD (Daily): Flat – No Dominant Trend Engine
The MACD line, signal, and histogram are effectively flat at zero on the data feed.
How to read it: price does not have a strong trending engine behind it on the daily chart. Any move here is more likely to be driven by liquidity pockets and sentiment spikes than by a well-established trend. Breakouts in this environment can either kick off a new trend or fail quickly. There is no clear inertia in either direction.
EMA Structure (Daily): Trend Undefined
The feed does not provide usable 20/50/200 EMAs for PUMPUSDT, so we have to infer structure from the regime tag: neutral.
How to read it: a neutral regime on the daily usually means price is chopping around its key moving averages instead of respecting them as clean support or resistance. Trend followers do not have a clear play; this is more of a range or transition phase.
Bollinger Bands (Daily): No Active Expansion or Squeeze Confirmed
The Bollinger Bands values are not populated, which normally would tell us about volatility expansion versus compression. Given the neutral regime and flat MACD, the odds favor a non-trending state over a strong directional squeeze.
How to read it: without evidence of a band expansion or tight squeeze, you should assume PUMPUSDT is not in an explosive daily volatility phase yet. Big moves can still happen because of order flow in a thin market, but the daily structure does not show a textbook breakout environment.
ATR (Daily): Volatility Context Missing
ATR is reported as zero in the feed, which is clearly a data gap rather than reality.
How to read it: for PUMP.fun style tokens, you should assume realized volatility is high even if ATR is not reported. Position sizing and leverage choices need to respect that structural risk.
Daily Pivots: Not Actionable From the Feed
Daily pivot, support (S1), and resistance (R1) levels come in as zeros, so we cannot anchor tactical zones off this dataset.
How to read it: price is trading in a structure where classical day-trader pivot levels are not the key driver. Liquidity pockets and psychological round numbers will matter more than textbook pivot math.
D1 takeaway: the main scenario from the daily chart is neutral. Momentum leans slightly positive via RSI, but trend and volatility tools are not confirming a strong directional bias. For a PUMP.fun-related asset, that means the next big move is more likely to be a fresh impulse rather than a continuation of a mature trend.
Hourly Timeframe (H1): Short-Term Buyers in Control
Moving down to the hourly, the tone brightens. The regime is flagged as bullish, with intraday momentum supporting that tilt.
RSI (14, H1): 60.28 – Active Intraday Upside Pressure
On the hourly, RSI up around 60 shows more decisive buying pressure than we see on the daily.
How to read it: short-term traders are leaning long. This is the type of RSI where intraday pullbacks tend to get bought as long as broader conditions do not deteriorate quickly. It fits the idea of a local up-leg inside a still-neutral larger structure.
MACD (H1): Flat, So the Bullish Tag Is More Price-Action Driven
Again, MACD itself comes through as flat, which tells us the bullish regime label is derived from price behavior relative to its averages rather than a powerful trending profile in the indicator.
How to read it: intraday direction is up, but it is not a runaway trend. It is the kind of environment where continuation is possible, but the move can still flip quickly if liquidity thins or a few large sellers show up.
EMAs (H1): Likely Above Short-Term Averages
With a bullish regime and positive RSI, price is likely trading above its short EMAs (20/50) on the hourly, though values are not printed in the feed.
How to read it: dips toward those intraday EMAs often act as the first line of support in a developing move. If price starts closing cleanly below them, the bullish intraday structure is probably unwinding.
Bollinger Bands & ATR (H1): Limited Detail, Elevated Risk
We do not get band or ATR values here either, which is common with illiquid or exotic pairs on some feeds.
How to read it: assume that even if the intraday direction is up, the path will be choppy. PUMP.fun pairs can overshoot the bands intraday and mean-revert violently without any neat indicator cues.
Hourly Pivots: Not in Play From This Dataset
Pivot levels show as zero on H1 as well.
How to read it: in practice, short-term PUMPUSDT flows are more likely to respect recent swing highs and lows and visible liquidity levels than textbook pivot lines.
H1 takeaway: hourly structure leans bullish, giving the first real tailwind for a near-term push higher. However, MACD is not confirming a strong trend, so we should treat this more as a fragile rally attempt inside a bigger neutral range.
15-Minute Timeframe (M15): Execution Context, Not a Thesis
The 15-minute chart is just about timing entries and exits, not building a core view. Still, its tone matters when it clashes with higher timeframes.
RSI (14, M15): 50.79 – Micro Consolidation
M15 RSI sitting around 51 is almost perfectly balanced.
How to read it: very short-term momentum has cooled off. After an intraday push, price is digesting rather than extending. That is often a staging phase. Either the next leg higher resumes with a breakout from this balance, or the lack of follow-through lets sellers lean in.
MACD, EMAs, Bands, ATR, Pivots (M15): Bullish Tag, Thin Evidence
The regime is marked bullish, but MACD and other values are effectively flat.
How to read it: on a 15-minute basis the structure is quietly positive, but without heavy confirmation. Scalpers will see this as an environment where buying dips inside the current micro-range can work, until it suddenly does not. Flexibility matters more than conviction here.
M15 takeaway: very short-term flow is trying to align with the bullish hourly bias, but momentum has paused. It is a wait-and-see micro-zone where the next impulse move will likely set the tone for the rest of the session.
Macro Backdrop for PUMP.fun Crypto: Fearful, Yet Speculative
The broader market context is important for something as sentiment-driven as PUMP.fun:
- Total crypto market cap: about $2.51T, up roughly 2.1% in 24 hours – risk assets are not collapsing; they are grinding higher.
- BTC dominance: near 57% – capital is crowding into Bitcoin, a defensive stance inside crypto.
- Fear & Greed Index: 15 (Extreme Fear) – positioning and mood are cautious to outright scared.
- DeFi activity: Uniswap v3 fees exploded higher on the day, with a 640% daily fee jump – that is a sign of concentrated trading activity somewhere in the long tail.
This mix – extreme fear plus rising BTC dominance, but still-growing total market cap and notable DEX fee spikes – is exactly the kind of environment where speculative PUMP.fun launches can attract short, violent bursts of flow. Traders hide in BTC until a narrative or ticker starts ripping, then rotate briefly into high-beta bets like PUMPUSDT, often in ultra-short-term fashion.
Main Scenario for PUMPUSDT (PUMP.fun Crypto)
Based on the daily neutral regime, slightly positive daily RSI, and bullish intraday structure, the main scenario right now is a neutral-to-constructive range rather than a clean bullish or bearish trend.
In practice, that means PUMPUSDT is in a zone where:
- Daily trend followers do not yet have a strong reason to commit size.
- Intraday traders can press the upside as long as the hourly bullish regime holds.
- Breakouts – in either direction – can quickly turn into new trends because the daily momentum is not stretched.
Clear Bullish Scenario
For the bullish case in PUMP.fun crypto to develop from here, you would want to see the following sequence play out:
1. Daily momentum pushes firmly above neutral.
RSI on D1 would need to climb sustainably into the 60–70 band with MACD lifting off the zero line and starting to trend positively instead of flat. That would turn the current mildly positive feel into a genuine upside drive.
2. Intraday bullish structure persists and strengthens.
On H1, RSI staying above 55–60 while price continues to hold above its short EMAs would show that dip buyers are in control. Short, shallow pullbacks that get bought quickly would confirm an emerging uptrend.
3. Volatility expansion on a break of recent highs.
Even though we do not have the exact Bollinger Bands, you would expect to see a decisive breakout above recent hourly or daily swing highs, ideally on rising volume. For PUMPUSDT, that would likely coincide with sudden social or media attention and a rush of order flow, a classic PUMP.fun-style extension.
What would invalidate the bullish scenario?
The bullish path breaks if:
- Daily RSI rolls back under 50 and stays there, flipping momentum back to the sellers.
- The H1 regime turns from bullish to neutral or bearish, with price failing to hold above intraday EMAs and repeatedly rejecting from prior highs.
- A breakout above recent highs immediately fails, trapping late buyers and sending RSI sharply back toward the 40s on the hourly.
Clear Bearish Scenario
The bearish case does not have confirmation yet, but the ingredients are on the table given the fearful macro mood.
1. Failure of the intraday bounce.
The first red flag would be H1 RSI falling back under 50 and staying there, while the bullish regime tag disappears. That would turn the current rally attempt into a failed bounce inside a broader neutral structure.
2. Daily momentum rotates down.
If daily RSI loses the mid-50s and slides into the low 40s, the market shifts from slightly constructive to downside-biased. A negative MACD cross away from the zero line would add weight to that move if and when it appears in the data.
3. Liquidity air pockets and long-liquidations.
Given the nature of PUMP.fun projects, once the bid dries up, price can skip through levels quickly. With extreme fear dominating sentiment, any sharp drop is likely to be met with more risk-off behavior, not immediate bargain hunting.
What would invalidate the bearish scenario?
The bearish path is off the table if:
- Hourly RSI recovers above 60 after a dip and the regime returns to clear bullish conditions.
- Daily RSI refuses to break below 50 on sell-offs, showing that every attempt to push lower is being absorbed.
- Breaks below recent lows fail quickly and turn into V-shaped reversals with strong upside follow-through.
Positioning, Risk, and Uncertainty
PUMP.fun crypto like PUMPUSDT is inherently binary: either you are catching an aggressive speculative wave or you are holding illiquid risk in an emotionally unstable market. The indicators we have paint a picture of a market that is trying to stabilize on the daily chart while intraday traders test the upside. That is not a backdrop for complacency.
For anyone trading this pair, the focus should be less on prediction and more on damage control and timing:
- Respect how quickly sentiment can flip in a market sitting in Extreme Fear, even as prices drift higher.
- Use the multi-timeframe structure: daily for bias (currently neutral), hourly for confirmation (currently bullish but fragile), and 15-minute for entries and exits around local ranges.
- Be prepared for volatility spikes that ignore textbook indicator levels; PUMP.fun flows can overwhelm technicals on short horizons.
Right now, PUMPUSDT is not locked into a clear bull or bear trend. It is sitting in the kind of neutral, slightly constructive pocket where the next catalyst, whether on-chain flow, social hype, or a broader market jolt, can decide the next leg. Your edge is not in guessing which way that coin flips, but in knowing exactly how your risk behaves when it does.
