




With the broader crypto market bouncing under fearful sentiment, Solana price today is attempting a cautious recovery while still battling a damaged higher-timeframe trend.
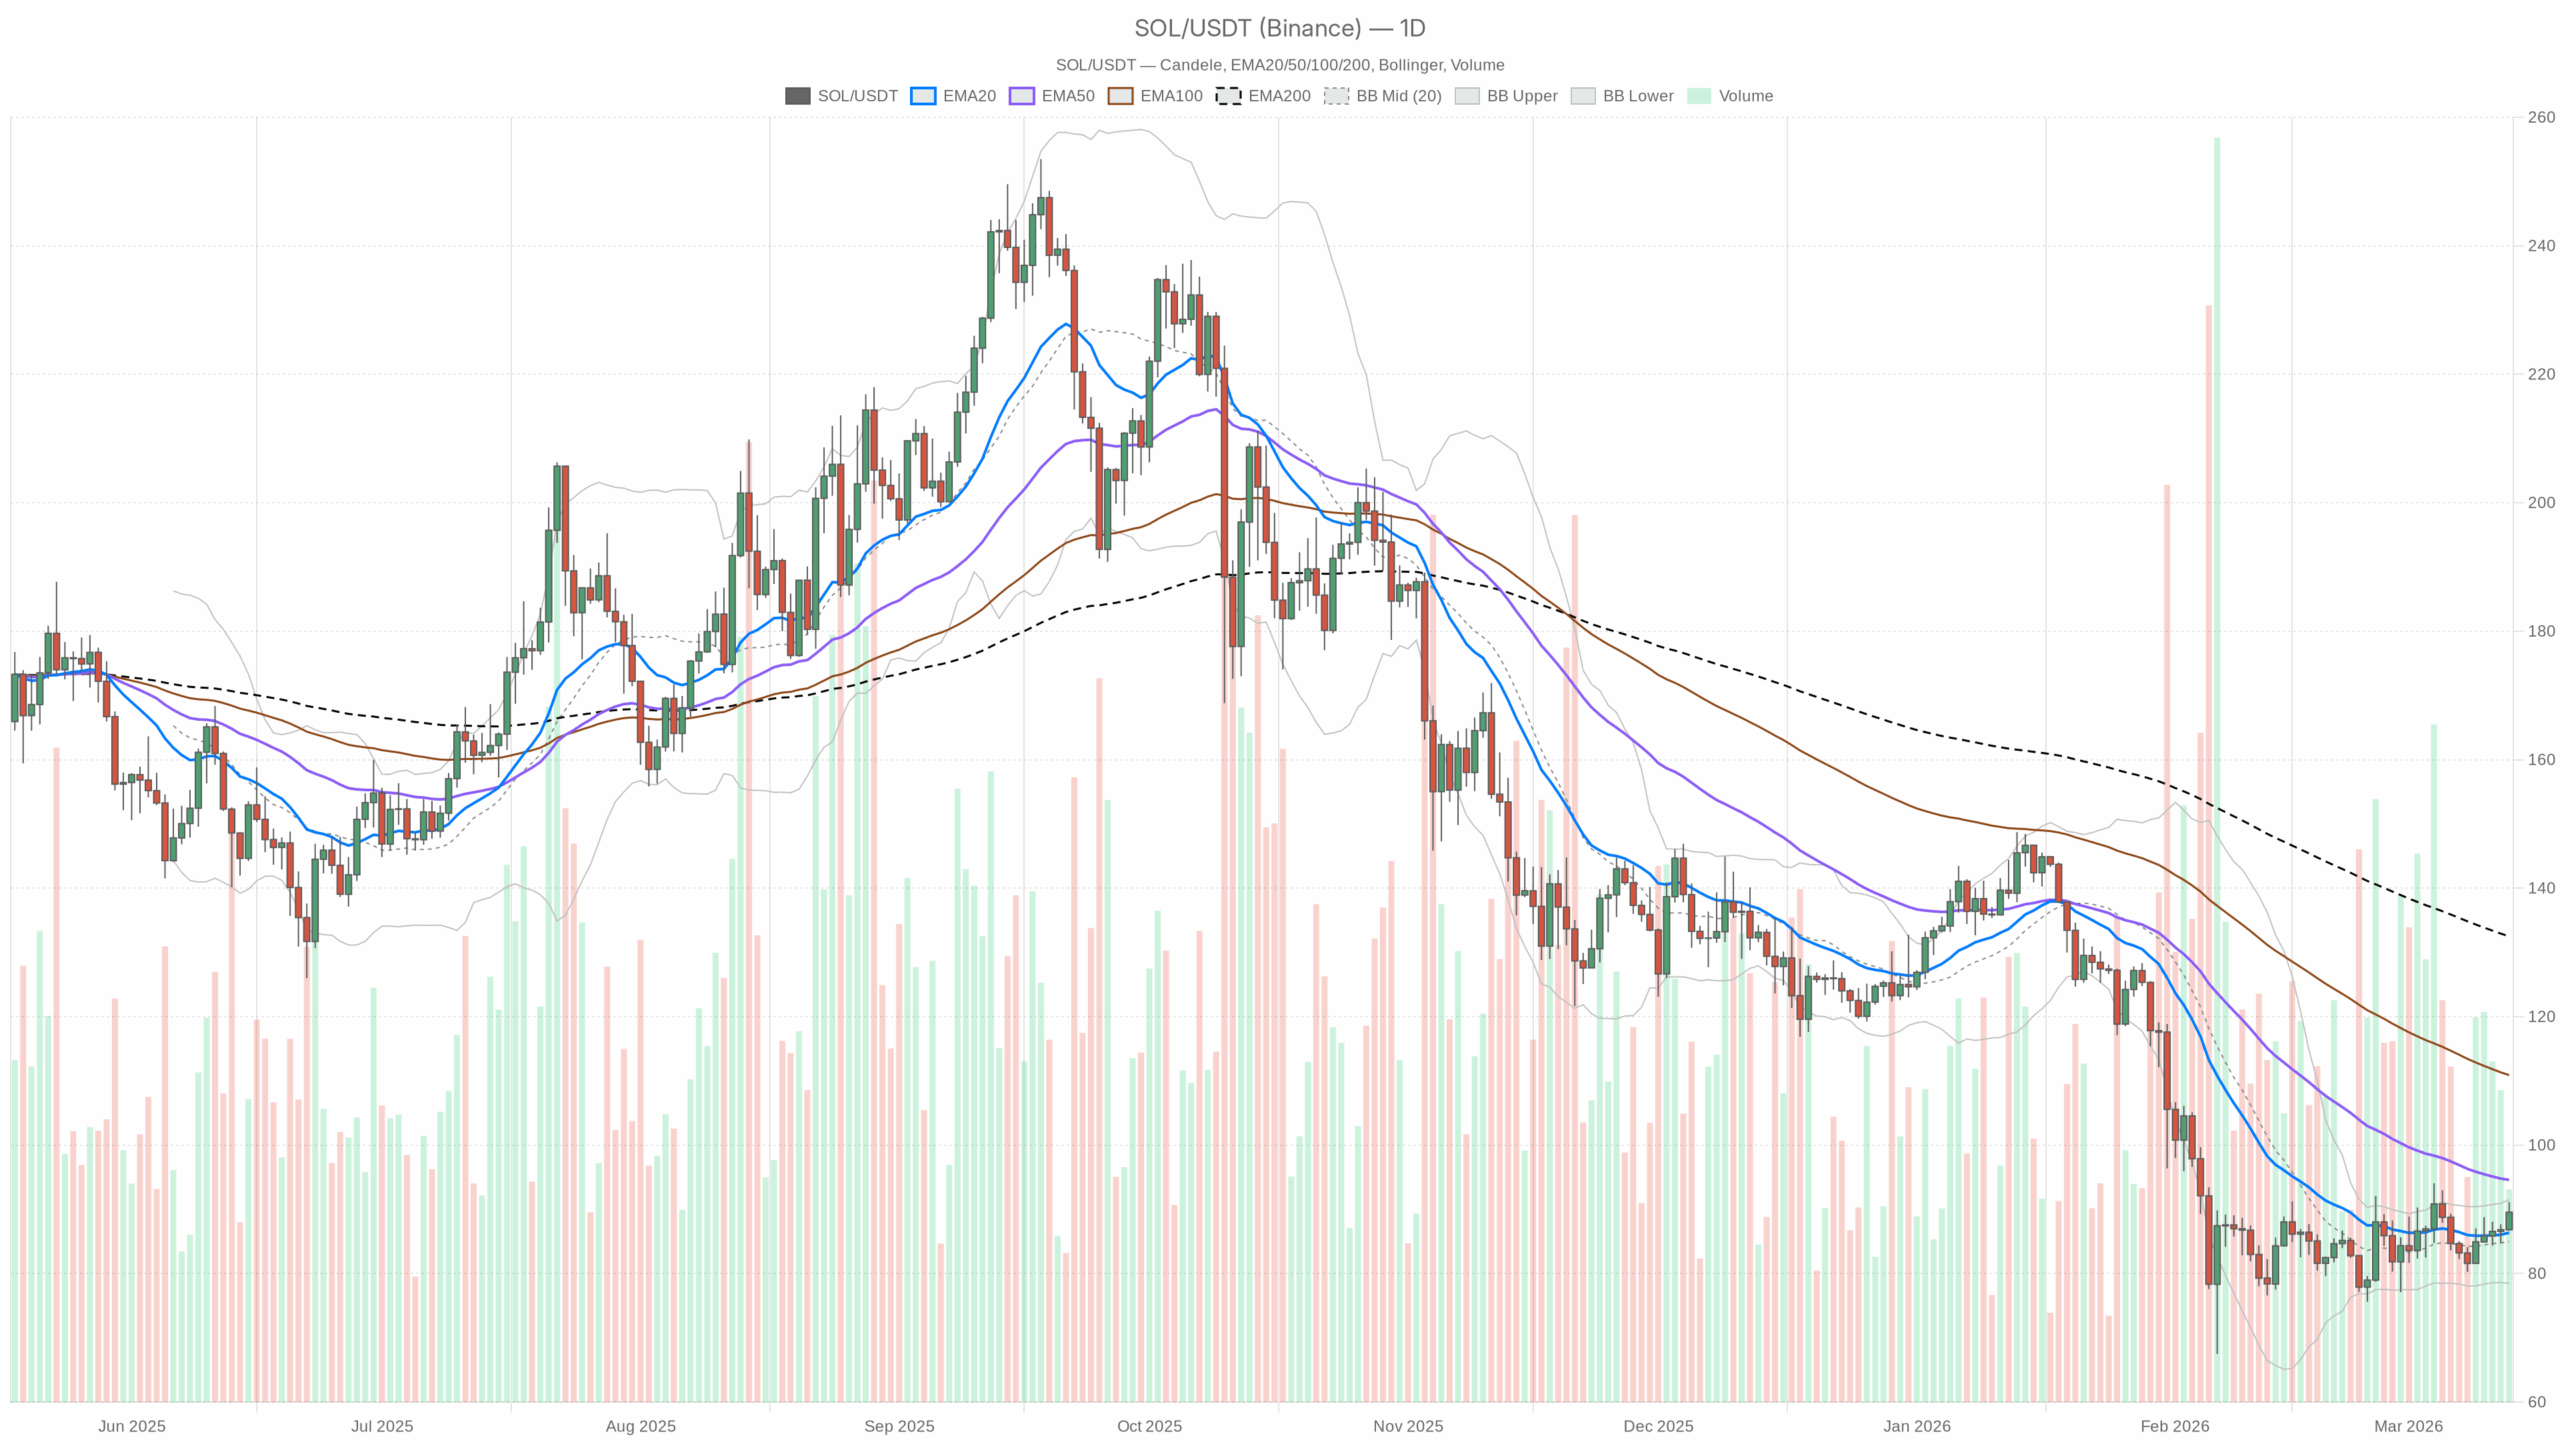 SOL/USDT daily chart with EMA20, EMA50 and volume”
loading=”lazy” />
Summary
Daily timeframe (D1): Neutral regime with early bullish pressure
Trend structure and EMAs
– Price: $89.56
– EMA 20: $86.38
– EMA 50: $94.59
– EMA 200: $132.50
Price is trading above the 20-day EMA but still below the 50-day and far below the 200-day. That usually means the short-term impulse is up, but the medium and long-term trend remain damaged. In practical terms, this looks more like a recovery bounce inside a broader downtrend than a clean, established uptrend.
For bulls, the first structural job is to reclaim the 50-day EMA around $94–95. Until that level is convincingly broken and held, every pop is vulnerable to selling from trapped longs and late shorts covering into strength.
RSI (Daily)
– RSI 14: 53.08
Daily RSI is just above 50, pointing to balanced-to-slightly-bullish momentum. There is no overbought or oversold condition here; buyers have stopped the bleeding and taken control of the short-term tape, but the move is far from euphoric. This supports the idea of a tentative recovery rather than a blow-off rally.
MACD (Daily)
– MACD line: -1.23
– Signal line: -2.39
– Histogram: 1.16
The MACD line has crossed above its signal while both remain below zero. That is a classic early-stage bullish crossover inside a damaged trend. Momentum is improving from a weak baseline: sellers have lost the initiative, but the market has not flipped into a strong bullish phase yet. Think of this as a repair phase after a down move, not a confirmed new bull leg.
Bollinger Bands (Daily)
– Middle band: $85.00
– Upper band: $91.50
– Lower band: $78.50
– Price: $89.56 (near upper band)
Price is trading above the middle band and leaning toward the upper band. In this context, that reflects a controlled upside push rather than manic volatility. The market has shifted from hugging the lower half of the range to pressing the top half, which fits the story of a short-term bullish rotation inside a wider consolidation or downtrend.
ATR (Daily) – Volatility backdrop
– ATR 14: $5.42
Daily ATR around $5.4 on an approximately $90 asset signals moderate volatility. Swings of 5–6% in a single day are normal right now. This is elevated enough that levels can be tested and failed quickly, but not in full-blown panic mode. Traders should expect whipsaws around key levels but not necessarily massive trend days every session.
Daily pivots and levels
– Pivot point (PP): $89.14
– R1: $91.56
– S1: $87.13
Solana is trading almost exactly at the daily pivot around $89. That defines the current zone as a decision area. Holding above $89 keeps the short-term bullish narrative intact and opens the door for a test of R1 near $91.5, which lines up with the daily upper Bollinger Band. Losing the pivot and sliding toward $87 (S1) would signal that today’s bounce is fading and invite a retest of the middle of the Bollinger range around $85.
Bottom line for D1: The main scenario is neutral-to-bullish. Short-term conditions favor buyers, but the higher-timeframe trend is still dominated by earlier damage, with the 50- and 200-day EMAs overhead acting as structural resistance.
1-hour timeframe (H1): Bullish intraday regime, pushing into local resistance
Trend and EMAs (H1)
– Price: $89.30
– EMA 20: $88.07
– EMA 50: $87.13
– EMA 200: $86.04
– Regime: Bullish
On the hourly chart, price is clearly above the 20, 50, and 200 EMAs, with those averages stacked in proper bullish order (20 > 50 > 200). This is a clean intraday uptrend. Dips toward the 20-hour EMA around $88 are currently being treated as pullbacks rather than trend breaks.
The tension is obvious: intraday flow is bullish, while the daily still has major resistance overhead. That combination often leads to mean-reversion trades off higher levels unless the hourly uptrend is strong enough to break the daily structure.
RSI (H1)
– RSI 14: 59.72
Hourly RSI is comfortably below 70 but above 50, aligned with a healthy, sustainable uptrend. Buyers have the upper hand, but the move is not stretched enough to scream blow-off. This supports continuation higher in the short term, as long as price stays above the key intraday supports.
MACD (H1)
– MACD line: 0.76
– Signal line: 0.67
– Histogram: 0.10
The hourly MACD is positive with the line just above the signal. Momentum is bullish but not explosive. This looks like a trend that is advancing steadily rather than a parabolic spike. However, the small histogram suggests momentum could roll over quickly if price stalls near resistance.
Bollinger Bands (H1)
– Middle band: $87.74
– Upper band: $90.75
– Lower band: $84.74
– Price: $89.30
On H1, Solana is trading in the upper half of the Bollinger range but not pinned to the band. Intraday, this paints a picture of controlled upside grind rather than wild volatility. The upper band around $90.7 is the first obvious resistance zone; it aligns closely with today’s R1 on the hourly pivot and sits just below the daily resistance zone in the low $90s.
ATR (H1) – Intraday volatility
– ATR 14: $1.16
Hourly ATR near $1.2 means that $1 intraday swings are baseline noise. For traders working off levels like $88–90, that volatility can easily trigger tight stops on either side of the range. Execution needs some breathing room; over-precision around exact levels is likely to be punished.
Hourly pivots
– Pivot point (PP): $89.10
– R1: $89.87
– S1: $88.52
Price is hovering just above the hourly pivot at $89.1. As long as Solana holds above this line, the intraday bullish regime remains in control and the tape favors a push toward R1 at $89.87 and possibly the hourly upper Bollinger near $90.7. A decisive drop back below $88.5 (S1) would warn that the intraday uptrend is losing steam and that the market might be reverting to the daily mid-range around $85–87.
15-minute timeframe (M15): Execution zone within a short-term uptrend
Trend and EMAs (M15)
– Price: $89.23
– EMA 20: $88.84
– EMA 50: $88.45
– EMA 200: $87.18
– Regime: Bullish
The 15-minute chart mirrors the hourly: price is above all key EMAs, which are stacked bullishly. This marks a short-term uptrend where dips toward the $88.5–88.8 region are currently getting bought. From an execution perspective, that area is the near-term battleground between breakout buyers and short-term profit-takers.
RSI (M15)
– RSI 14: 56.87
RSI on M15 is mildly bullish, not overextended. Momentum is positive but flattening, which often happens when price pauses under resistance. It signals constructive consolidation as long as price does not fall back through the short-term EMAs with force.
MACD (M15)
– MACD line: 0.01
– Signal line: 0.05
– Histogram: -0.04
On the 15-minute chart, MACD is essentially flat with a slightly negative histogram: micro momentum has cooled. The short-term push is pausing, not yet reversing. This matches what the Bollinger Bands and pivots show: a market catching its breath under resistance.
Bollinger Bands (M15)
– Middle band: $88.95
– Upper band: $89.69
– Lower band: $88.21
– Price: $89.23
Price is sitting close to the middle band with relatively narrow bands overall. That combination points to a short-term consolidation pocket inside a broader intraday uptrend. Breaks out of this mini-range will likely guide the next leg on the hourly chart.
15-minute pivots
– Pivot point (PP): $89.23
– R1: $89.67
– S1: $88.78
Price is exactly on the M15 pivot, reinforcing the idea that the market is coiling at an intraday decision point. A move through $89.7 would align with tests of higher intraday resistance levels and the upper hourly band, while losing $88.8 would hint at a deeper pullback toward the hourly support zone near $88 and possibly the daily mid-range.
Market context: Fearful sentiment, BTC-led tape, and Solana’s share
The broader crypto market cap stands around $2.51T, up about 2.1% in the last 24 hours, with Bitcoin dominance at approximately 57%. That combination tells you the bounce is top-heavy: capital is flowing primarily into Bitcoin, with majors like Solana following but not leading.
Solana commands roughly 2.0% of total crypto market cap, which is sizeable, but in an Extreme Fear environment, altcoins usually lag until Bitcoin stabilizes and risk appetite improves. The intraday uptrend in Solana is therefore fighting both its own damaged daily chart and a cautious market mood.
Bullish scenario for Solana
The constructive path for Solana from here is a continued repair of the daily trend, powered by the existing intraday strength.
Key ingredients for the bullish case:
1. Hold above daily pivot ($89) and hourly support ($88–88.5):
As long as price respects this band on closing bases, the short-term uptrend remains intact. It shows buyers are willing to defend new higher lows rather than retreat to the mid-80s.
2. Break and sustain above $91–92:
This zone combines the daily upper Bollinger Band and the daily R1. Clearing and holding above it on the daily close would turn the current bounce into a more serious attempt at trend repair, opening the path toward the 50-day EMA near $94–95.
3. Reclaim the 50-day EMA (around $94–95):
If Solana can close multiple days above $95, the market begins to shift from “sell rallies” to “buy dips.” The daily regime would tilt decisively bullish, especially if RSI moves toward the 60s and MACD crosses above the zero line.
If these conditions play out, upside reference points would be $95 (50-day EMA), then the psychological $100 zone. Beyond that, the bigger fight is against the long-term trend with the 200-day EMA up at $132.5, but that is a secondary step that depends on how macro risk sentiment evolves.
What invalidates the bullish scenario?
A sustained break below $87–88 with daily closes under the 20-day EMA (around $86.4) would be a clear warning that the rally is failing. That would likely drag RSI back under 50 and flatten or reverse the MACD crossover, shifting the daily bias back toward a sell-the-rip environment.
Bearish scenario for Solana
The bearish path assumes the current strength is just a corrective upswing in a larger downtrend, driven by short covering and mean reversion rather than real appetite for risk.
Key elements of the bearish case:
1. Failure at $91–92 and/or $94–95:
If Solana repeatedly rejects the daily upper band and cannot crack the 50-day EMA, it would signal that sellers are defending the mid-90s. That is where medium-term shorts are most likely to lean in again.
2. Breakdown below $87–88:
Losing this area would damage the intraday bullish structure on both the 1-hour and 15-minute charts. It would turn the current pivot zone into resistance and invite a slide back toward the daily middle Bollinger band around $85, and possibly the lower band region in the high $70s if fear intensifies.
3. Momentum rollover on D1:
If daily RSI drops back below 50 while MACD’s histogram turns negative again, it would confirm that the momentum repair failed. In that case, the path of least resistance shifts back to the downside, especially in an Extreme Fear environment with Bitcoin dominance high.
Under this scenario, downside reference points would be the $85 mid-band area first, then the $78–80 lower-band zone if selling accelerates. A move into those levels would likely coincide with renewed risk-off flows across majors, not just Solana.
What invalidates the bearish scenario?
The bears lose the narrative if Solana can establish multiple daily closes above the 50-day EMA ($94–95) while keeping RSI and MACD trending higher. That kind of behavior typically shifts positioning from aggressive shorting of rallies to cautious accumulation on pullbacks.
How to think about positioning right now
Solana today sits at an interesting crossroads: intraday charts are clearly bullish, while the daily and sentiment context are still skeptical. That kind of divergence usually leads to two-way volatility around obvious levels, exactly like the $89–92 pocket currently in play.
For market participants, the key is recognizing that:
– Short term: The 1-hour and 15-minute trends support buying pullbacks as long as price holds above the $88–89 band. Momentum is with the bulls on these timeframes.
– Higher timeframe: The daily structure still has heavy resistance above, particularly around $94–95 and far more at $130+. This is not a clean, late-cycle breakout environment; it is a trend repair attempt under macro caution.
Volatility is moderate but meaningful: daily ATR around $5 implies that even “normal” moves can test both support and resistance intraday. Extreme Fear in sentiment adds another dimension. Negative surprises can still hit hard, while positive surprises can trigger sharp short-covering spikes.
In short, Solana price today reflects a market trying to heal inside a broader risk-off backdrop. The next few days around the $88–92 range will decide whether this is just another bounce to fade, or the beginning of a more durable shift toward strength on the daily chart.
