




Corning stock remains in a primary bullish trend despite a sharp pullback from fresh highs. GLW still trades well above major daily moving averages, so the broader structure remains constructive even as short-term momentum cools and volatility rises.
Summary
Corning Stock Keeps Its Daily Uptrend Intact
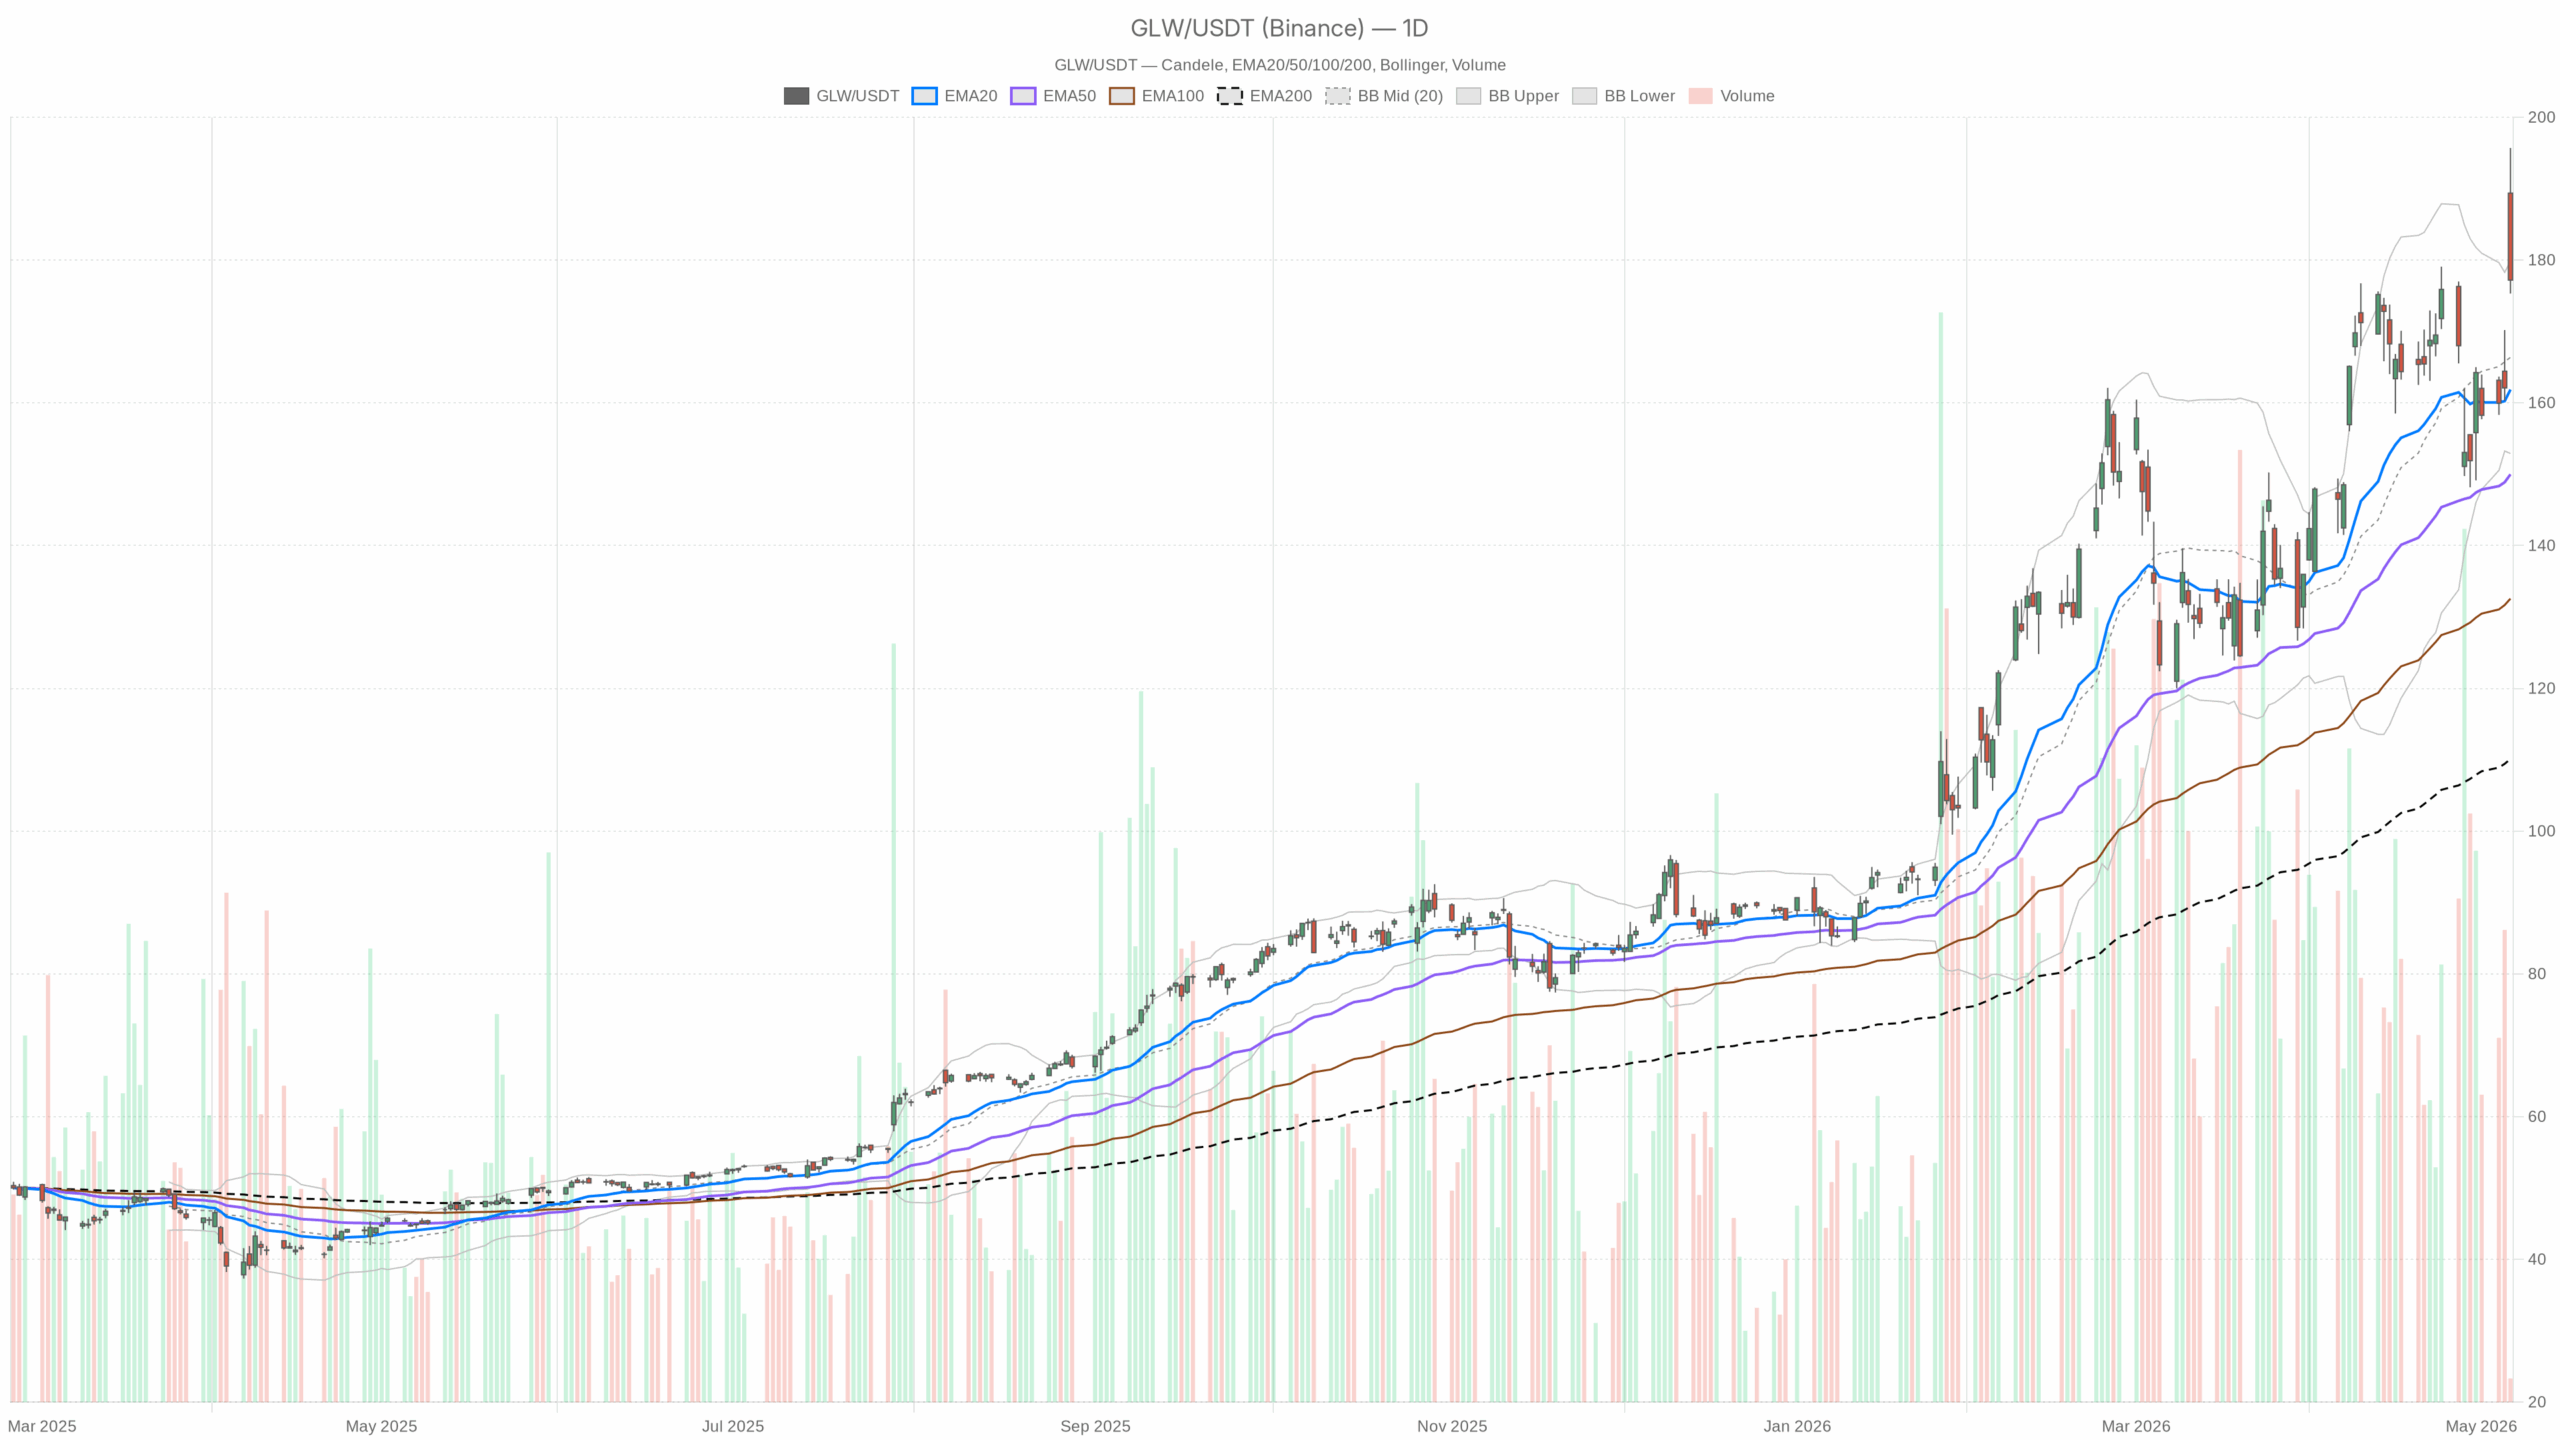
GLW closed at 177.20, well above its 20-day EMA at 161.86, 50-day EMA at 149.98, and 200-day EMA at 110.10. That alignment keeps the broader structure firmly bullish. It also shows buyers still control the main trend despite the latest volatility.
At the same time, the latest session was not clean. GLW traded as high as 195.71 before reversing sharply and closing below the daily pivot at 182.74. It also finished under the upper Bollinger Band at 179.84 after pushing through it intraday. That points to a failed extension, not a stable breakout.
In other words, Corning stock is still trending higher on the daily timeframe. However, the market is now testing whether momentum can absorb an overextended move.
Corning Stock Momentum Cools as Volatility Stays Elevated
Daily momentum remains positive, though it has clearly cooled. The daily RSI stands at 62.27, which keeps GLW in bullish territory without signaling exhaustion on its own. That leaves room for buyers if demand returns.
However, the daily MACD is less convincing. The MACD line is 4.48 versus a 5.28 signal line, leaving a negative histogram of -0.80. That shows upside momentum has slowed. It also confirms the latest pullback is more than random noise.
Notably, volatility is elevated. Daily ATR sits at 10.97, which helps explain the wide session range between 175.31 and 195.71. Therefore, the trend direction remains up, but price swings have become aggressive and less forgiving.
The nearest daily pivot levels define the current battleground. Resistance comes in at 190.17, while first support sits at 169.77. A recovery through the pivot zone would help restore control to the bulls. On the other hand, a deeper slide toward support would raise the risk of a broader reset.
AI News Supports the Corning Stock Re-Rating
The fundamental backdrop has clearly helped fuel this move. News around Nvidia’s new $500 million AI infrastructure deal with Corning adds a credible growth catalyst. It also helps explain why GLW reached an all-time high area.
Additional attention around Corning’s Meta AI relationship, recent quarterly results, and guidance has reinforced the narrative. The company is becoming more directly tied to AI infrastructure spending. That news flow supports the longer-term bid, even if the stock now needs to absorb a very fast re-rating.
1-Hour Chart Shows Strength but Also Stretch
Trend Structure Remains Supportive
Meanwhile, the 1-hour chart broadly confirms the daily bullish bias. GLW remains above its 20-hour EMA at 162.94, 50-hour EMA at 162.07, and 200-hour EMA at 157.52. That alignment confirms trend strength beneath the price action. It also suggests the pullback has not yet broken the intermediate structure.
The implication is straightforward. Intraday weakness still sits inside a broader uptrend for now.
Short-Term Momentum Looks Overextended
However, the 1-hour momentum profile is hotter than the daily one. RSI is 75.05, which points to an overbought condition on that timeframe. At the same time, MACD remains positive, with the line at 2.01 above the 0.97 signal line and a histogram of 1.04.
That tells us momentum has not fully rolled over. Still, it also reflects a market that may need consolidation before it can sustain another leg higher. The 1-hour Bollinger upper band is 169.94, and price is still far above that area. That gap reinforces how extended the recent surge has been.
Timeframe Cross-Current Keeps the Setup Delicate
There is a real cross-current between timeframes. The daily trend is bullish, and the 1-hour trend agrees. Yet the daily MACD has softened, while the 1-hour RSI is already overbought.
Therefore, the bigger trend remains constructive. However, the shorter-term setup is no longer ideal for chasing strength after a vertical move and reversal from the highs.
15-Minute Chart Provides Execution Context
The 15-minute chart is useful mainly for execution context. GLW closed at 177.20, almost exactly around the 15-minute pivot at 177.73, after trading between 176.18 and 179.81. That points to a near-term balance zone after the initial shock move.
Price remains above the 15-minute EMAs, with the 20-period at 168.57, the 50-period at 164.94, and the 200-period at 162.50. That keeps micro-trend support intact. Meanwhile, the 15-minute RSI at 65.85 and positive MACD readings show buyers are still active, though not with the same urgency seen at the session peak.
Corning Stock Bullish Scenario
For the bullish scenario, Corning stock needs to stabilize above the 15-minute and hourly pivot region. It then needs to reclaim the daily pivot at 182.74 with more conviction. If buyers can do that, the next technical focus shifts back toward 190.17 and ultimately the recent high near 195.71.
A successful reclaim of those levels would tell the market that the post-news selloff was profit-taking rather than the start of a larger unwind. In that case, the daily trend would reassert itself, supported by the still-bullish EMA structure and a news backdrop tied to AI infrastructure demand.
GLW Bearish Scenario and Key Support Levels
On the other hand, the bearish scenario is now easy to define. If GLW continues to fail below the daily pivot and slips through intraday support, the market is likely to test the lower end of today’s reversal zone.
A sustained break under the 15-minute support at 175.65 would increase the pressure. From there, the more important daily support sits at 169.77. A move toward that level would not automatically break the long-term uptrend. However, it would invalidate the idea that buyers immediately regained control after the spike.
It would also fit with the weakening daily MACD and the possibility that the stock needs a broader cooling phase after reaching an all-time high.
Overall Corning Stock Outlook
Overall, Corning stock still deserves a bullish main label because the daily trend remains intact and price is holding well above all major daily moving averages. However, the path is no longer straightforward.
Short-term momentum is stretched, volatility is high, and the failed push above the upper daily band leaves room for further consolidation. For now, GLW looks like a strong trend stock entering a more delicate phase, where holding support matters more than celebrating the headline-driven breakout.
