

SK Telecom Stock (SKM) remains in a primary uptrend on the daily chart, while near-term momentum has cooled. The structure points to a bullish main scenario, but the tape is pausing just under resistance. That mix argues for patience on entries and respect for nearby support.
Summary
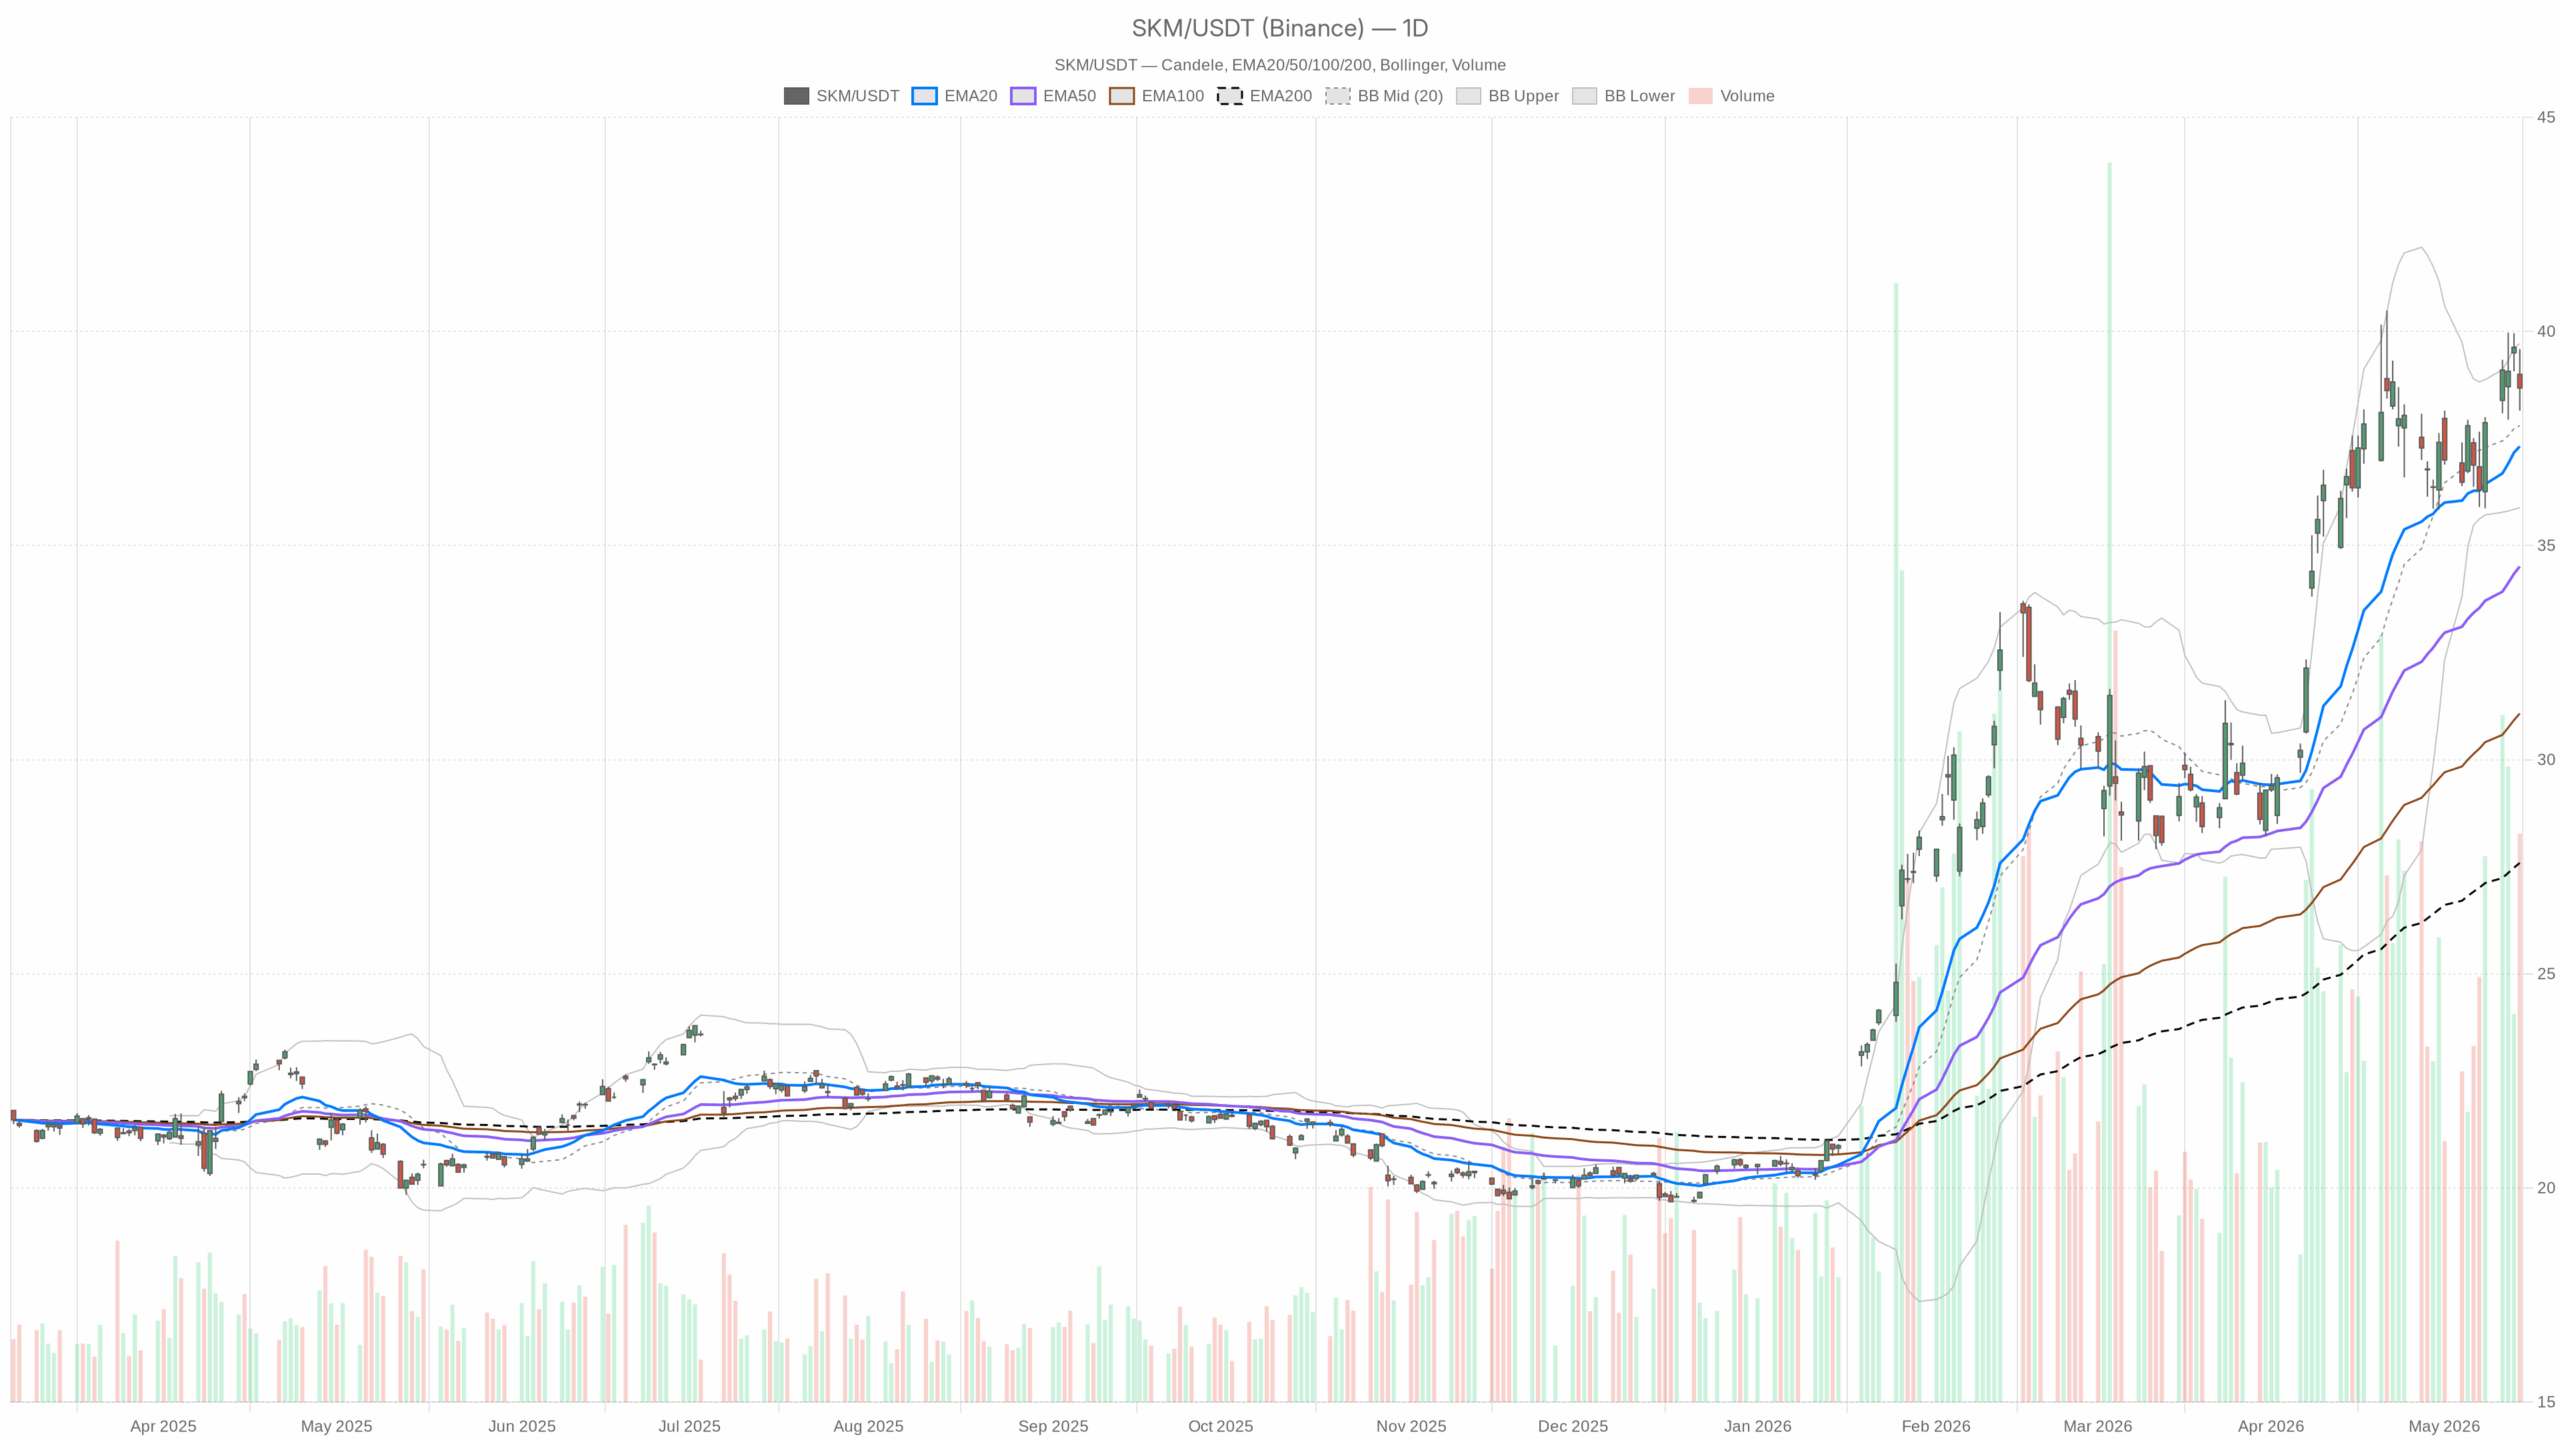
SK Telecom Stock Daily Outlook: Uptrend Intact Near Resistance
Trend and Momentum
On the daily timeframe, the regime is bullish. Price closed at 38.68, above the 20-day EMA at 37.32, the 50-day EMA at 34.51, and the 200-day EMA at 27.59. Those rising averages confirm trend strength. Daily RSI sits at 60.57, which signals positive momentum without overbought risk. Daily MACD shows the line at 1.30 versus a 1.36 signal with a -0.06 histogram, a mild negative cross. That softening histogram flags short-term fatigue inside an uptrend.
Meanwhile, Bollinger Bands center on 37.80 with an upper band at 39.72 and a lower band at 35.89. Trading beneath the upper band implies resistance is close but not yet stretched. ATR(14) near 1.42 indicates moderate daily volatility. That range allows tests of nearby levels without breaking trend. The daily pivot is 38.81 with R1 at 39.46 and S1 at 38.02. Those levels frame the immediate battlefield.
Hourly Chart: Pause Within Larger Uptrend
Meanwhile, the H1 regime reads neutral, which reflects a pause rather than a reversal. Price is below the 20-EMA at 38.99 but above the 50-EMA at 38.41 and well above the 200-EMA at 36.42. That alignment signals an intraday dip within a larger uptrend.
H1 RSI prints 47.61, showing momentum has cooled to neutral. In addition, H1 MACD carries a -0.13 histogram, indicating fading upside follow-through. Bollinger Bands on H1 place the mid near 39.13 with the lower band at 38.32. Trading below the mid and nearer the lower band points to consolidation risk rather than trend damage. H1 ATR(14) at 0.57 suggests contained intraday swings. The hourly pivot sits at 38.80 with R1 at 38.94 and S1 at 38.52. Holding above S1 would keep the pullback orderly.
15-Minute Context for SK Telecom Stock Entries
At the same time, the 15-minute view offers execution context. Price sits below the 15m 20-EMA at 39.07 and the 50-EMA at 39.08, but above the 200-EMA at 38.27. This shows a short-term pullback within a broader uptrend. The 15m RSI at 37.87 indicates near-term selling pressure, not capitulation. The 15m MACD is slightly negative with a small red histogram, a lack of immediate upside drive.
Notably, Bollinger Bands show a mid near 39.08 and a lower band at 38.69, with price around 38.66. Trading at the lower band hints at mean-reversion potential. The 15m ATR(14) near 0.25 reflects tight micro ranges. The 15m pivot is 38.78 with R1 at 38.91 and S1 at 38.54. Price clustering between the pivot and S1 signals a tactical decision zone.
Fundamental Backdrop: Profit Beat Supports Dips
Notably, recent coverage highlighted an operating profit beat in 1Q26 with catalysts intact. That fundamental backdrop can underpin dips during technical consolidations. It helps reduce downside asymmetry while the market re-tests resistance on SK Telecom Stock.
Main Bullish Scenario: Breakout Confirmation Over Pivots
Therefore, the main scenario remains bullish on the daily timeframe. The uptrend is intact above the 20-day EMA at 37.32, and momentum is constructive with RSI near 61. A push back through the daily pivot at 38.81, followed by the hourly R1 at 38.94, would confirm renewed demand.
That sequence would open a run toward 39.46 (daily R1) and the upper Bollinger band near 39.72. A firming H1 RSI back above 55 and a positive turn in the H1 MACD histogram would strengthen the case. These intraday momentum shifts would indicate the pause is ending.
Bearish Counter-Scenario: Levels That Threaten Structure
However, a bearish counter-scenario cannot be ignored given the soft hourly tone. Failure to reclaim 38.81 and repeated rejection near 38.90 could invite a drift to 38.52 (H1 S1) and 38.02 (daily S1). A daily close below 38.02 would damage the near-term structure.
A deeper risk emerges on a break of the 20-day EMA at 37.32. That would flip the daily momentum profile, especially if daily RSI sinks toward 50 and the MACD histogram expands further negative. Such signals would invalidate the bullish case for now.
Volatility and Near-Term Ranges
Finally, volatility remains manageable with a daily ATR near 1.42 and an hourly ATR near 0.57. That context sets realistic ranges for tests of pivots and bands. Until momentum turns up on H1, expect two-way trade below resistance, with the primary trend still pointing higher on SKM.
Bottom Line on SKM
Overall, the timeframes are aligned enough to keep a bullish daily bias, but H1 and 15m show digestion. That mix argues for breakout confirmation rather than anticipation. Intraday momentum needs to re-engage for the uptrend in SK Telecom Stock to press fresh swing highs.