




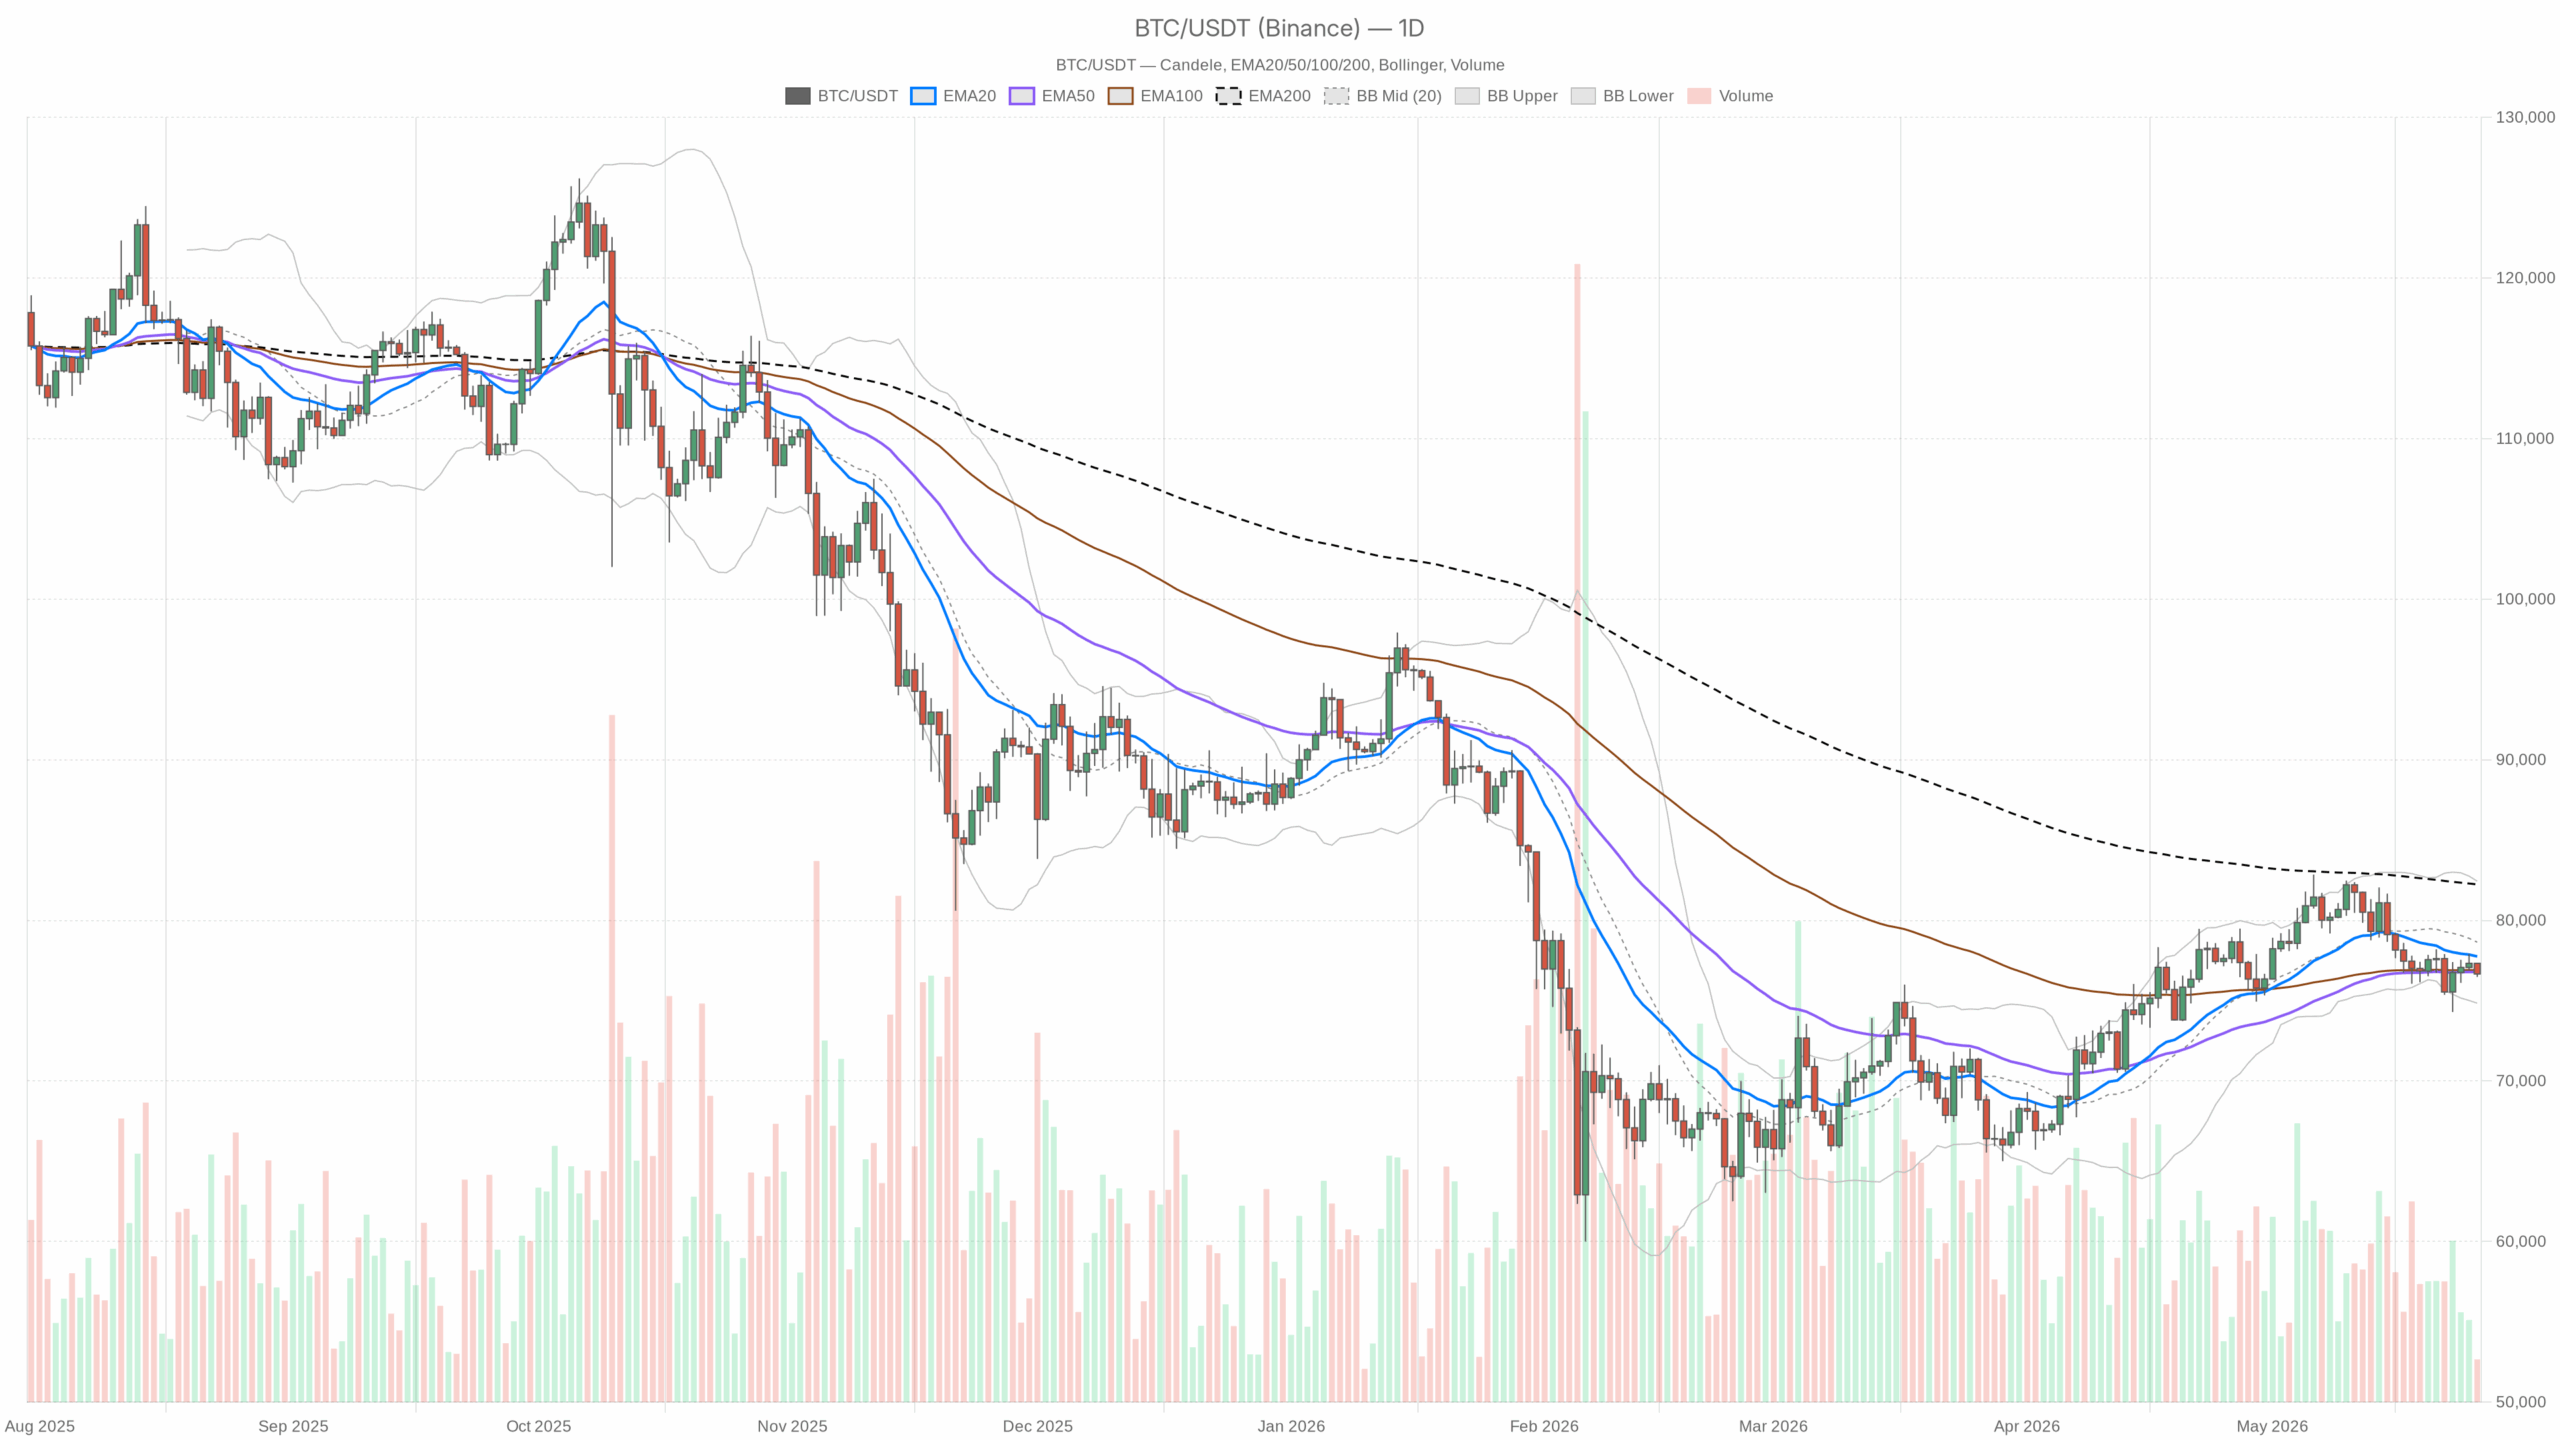
Momentum has cooled as Bitcoin trades around 76,662 and hugs the lower half of its range; Bitcoin price today sits beneath short-term resistance, with sellers capping bounces at the 20-day EMA while buyers defend the lower Bollinger band.
Risk appetite across crypto is muted, with the Fear & Greed Index at 34 and BTC dominance near 58%. In short, this backdrop favors defensive positioning and fade-the-rip behavior until the tape proves otherwise. Structure is range-bound, but momentum tilts bearish into support.
As of 26 May 2026, key levels remain clustered just below 77k, and intraday flows look fragile.
Summary
Trend vs. mean reversion, momentum vs. structure
On the daily, structure is neutral and range-like, while momentum has weakened. However, hourly action confirms sellers are pressing, and the 15-minute shows early stabilization rather than a clean reversal. That keeps the base case neutral, with a bearish lean unless the market reclaims the 20-day EMA.
Multi-timeframe view
Daily (macro bias): Neutral — Bitcoin price today sits just below the 50-day EMA and well under the 20-day EMA. Bears control momentum, but bulls still have nearby structure at the lower band. The tape is coiled between mean reversion back toward 78–79k and a slip toward ~75k.
1H (tactical): Weak — Meanwhile, price is below the 20/50/200 EMAs with softening RSI and negative MACD. Intraday rallies face supply into 76.8–77.2k unless reclaimed with energy.
15m (execution): Stabilizing — That said, price is heavy but starting to carve a short-term base near local pivots; a tiny positive turn in the MACD histogram hints at waning sell pressure.
Indicator readouts with plain-English takeaways
Daily (D1)
- EMAs: EMA20 = 77,752; EMA50 = 76,783.88; EMA200 = 82,236.97. Price (76,661.75) is just under the 50-day and well below the 20-day and 200-day — sellers have the momentum edge until price reclaims ~77.8k.
- RSI(14): 45.52. Sub-50 and drifting — pressure is on the downside, but not washed out; room exists for either continuation lower or a mean-reversion bounce.
- MACD: Line = -244.77; Signal = 148.87; Histogram = -393.64. Deeply negative histogram — downside momentum has been in charge; bulls need a flattening histogram to argue for a turn.
- Bollinger Bands: Mid = 78,640.23; Upper = 82,437.74; Lower = 74,842.71. Trading in the lower half — compression against the lower band often precedes either a tag of support near ~74.8k or a snapback toward the mid-band (~78.6k).
- ATR(14): 1,924.37. Typical daily range ~1.9k — enough volatility to traverse today’s pivots and test nearby bands in a single session.
- Daily Pivots: PP = 76,827.45; R1 = 77,179.30; S1 = 76,309.89. Spot is hovering just below PP — intraday tape leans heavy while below PP; losing S1 risks a drive toward the lower band.
Hourly (H1)
- EMAs: EMA20 = 77,023.16; EMA50 = 76,992.76; EMA200 = 77,207.35. Price (76,636) sits beneath all three — rallies are sellable unless price reclaims the 76.9–77.2k cluster.
- RSI(14): 39.36. Weak — sellers control the tape on this timeframe.
- MACD: Line = -117.93; Signal = -43.72; Histogram = -74.21. Negative and expanding earlier — momentum is still down, though watch for histogram tightening to flag a pause.
- Bollinger Bands: Mid = 77,175.62; Upper = 77,917.99; Lower = 76,433.25. Price is hugging the lower band — oversold intraday but not capitulatory.
- ATR(14): 295.49. Expect ~300-point hourly swings — plenty to whip unsuccessful breakout attempts.
- Hourly Pivots: PP = 76,721.43; R1 = 76,839.12; S1 = 76,518.30. Trading just under PP — sellers have a small edge; a sustained move above R1 would be the first sign of intraday repair.
15-Minute (M15)
- EMAs: EMA20 = 76,806.40; EMA50 = 76,958.10; EMA200 = 76,937.81. Price (76,636) is below the entire stack — near-term trend is down unless we base and reclaim 76.8k.
- RSI(14): 38.40. Soft — sellers still pressing, but getting closer to levels that often attract quick bounces.
- MACD: Line = -52.54; Signal = -56.25; Histogram = 3.71. A small positive tick in the histogram — early hint that downside energy is stalling, not a reversal by itself.
- Bollinger Bands: Mid = 76,759.69; Upper = 77,001.33; Lower = 76,518.06. Price sits between mid and lower band — scope for a nudge back to ~76.9–77.0k if sellers pause.
- ATR(14): 118.36. Micro swings are ~100–120 points — execution needs tight risk or wider timeframes.
- 15m Pivots: PP = 76,657.34; R1 = 76,678.67; S1 = 76,614.66. Price is a touch under PP — watch the PP/S1 band for a base; flips back above PP often fuel quick scalps toward R1.
Scenarios
Main scenario (based on D1): Neutral — Overall, range behavior with a bearish tilt. Expect chop between ~74.8k (lower band) and ~78.6k (mid-band) while momentum cools or re-accelerates.
Bullish path: Reclaim 76,827–77,179 (daily PP to R1) and then 77,752 (EMA20). A daily close back above the mid-band ~78,640 opens 79.5–80k, with 82,237 (EMA200) the next meaningful test. This would mark a momentum repair rather than a full breakout.
What invalidates the bullish path: Failing to hold above 76k after a reclaim, or a daily close below ~74,843 (lower band) — that would hand control back to sellers.
Bearish path: Conversely, lose 76,309 (daily S1) and press toward the lower band at ~74,843. With a daily ATR near 1,924, a one-session tag is not far-fetched. A clean break and close below the band would expose the low-74k/high-73k pocket.
What invalidates the bearish path: A strong reclaim and daily close above 77,752 (EMA20) and preferably the mid-band ~78,640 — that flips momentum and puts 80k back in play.
Positioning and risk
That said, this is still a range tape with negative momentum. Tactically, that favors fading moves into 77.8–78.6k and buying dips closer to 75–75.5k — but only with clear intraday confirmation, such as H1 back above PP/R1 and an M15 EMA stack flip.
Moreover, respect the ATR: daily ~1.9k, hourly ~300, 15m ~120. Levels can be crossed quickly, and failed breakouts are likely while the hourly stays below its EMA cluster.
Bottom line: Bitcoin’s price today is pinned just under key short-term resistance. Until the daily reclaims the 20-day EMA, rallies are suspect; until the lower band breaks, selloffs are too. Let the levels do the talking and size positions for a choppy, headline-sensitive market.
