




With XRP pinned near $1.34 amid compressed volatility, Ripple price today sits at a pivotal spot as traders crowd into safer majors and reduce risk.
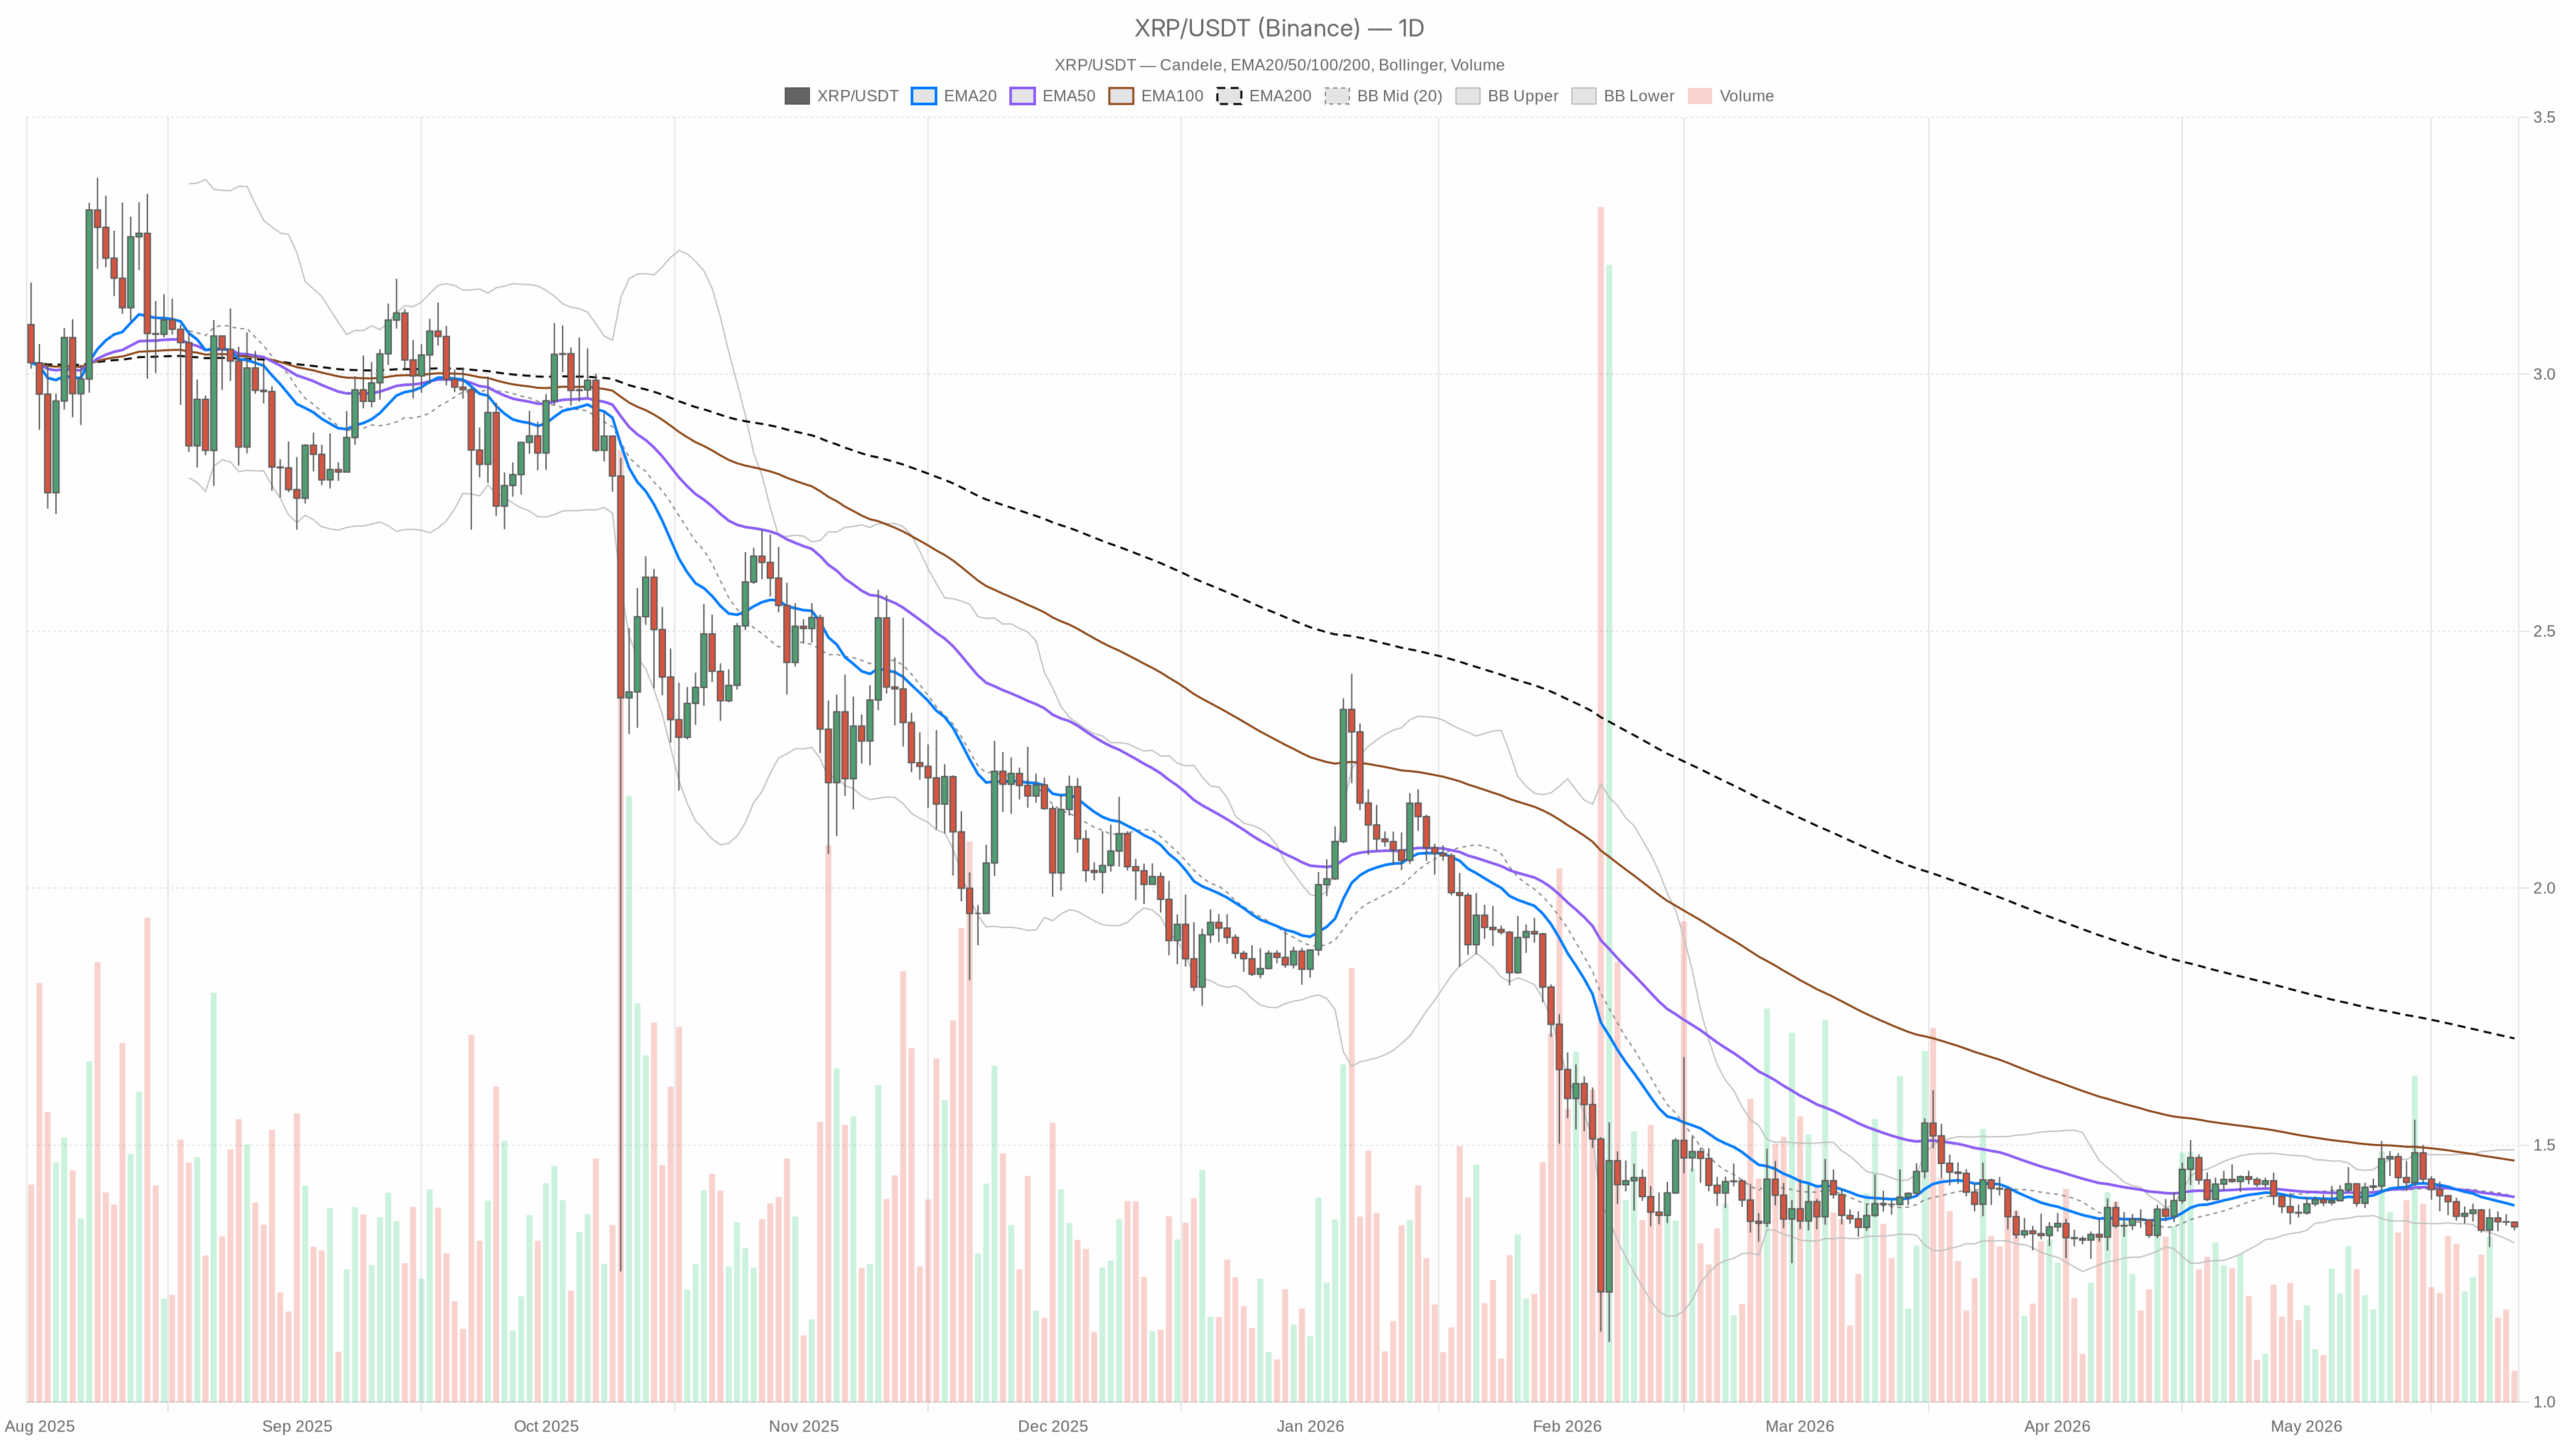
Currently, XRP is stuck at $1.34 and trading beneath every meaningful moving average. Ripple price today matters because the tape is coiling at the bottom of the range while the broader crypto market leans defensive. The dominant force is risk reduction as participants favor BTC and stable pairs.
However, this is a momentum-versus-structure moment. Structure is bearish (below MAs, hugging the lower Bollinger band), while momentum is muted rather than capitulatory. Compressed volatility implies the next push can travel; the battleground sits between $1.33 and $1.35.
Summary
Macro market context
As of 26 May 2026, conditions remain fragile across digital assets.
Meanwhile, BTC dominance: 58.20% — capital is crowding into BTC. For XRP, that usually means headwinds for sustained bids.
Moreover, Total crypto market cap (24h): -0.85% — a soft tape with limited dip-buying appetite.
That said, Fear & Greed Index: 34 (Fear) — risk appetite is low; rallies face faster profit-taking.
Daily bias (D1 sets the main scenario: Bearish)
On D1, Close $1.34 vs EMA20 $1.38, EMA50 $1.40, EMA200 $1.71. Interpretation: price is below all key trend filters; sellers retain structural control.
Additionally, RSI(14): 40.38. Interpretation: weak momentum but not washed out; room exists for a further drift lower without a classic oversold snapback.
Furthermore, MACD: line -0.02, signal -0.01, hist -0.01. Interpretation: bearish bias with a shallow downside impulse; no convincing turn yet.
Meanwhile, Bollinger Bands: mid $1.40, upper $1.49, lower $1.31. Interpretation: price is camped near the lower band; pressure is down but there is no clean breakdown as long as $1.31 holds.
Consequently, ATR(14): $0.05. Interpretation: contained daily volatility (~3–4% of price); a break from this compression can accelerate once it starts.
Overall, Daily pivot levels: PP $1.34, R1 $1.35, S1 $1.33. Interpretation: XRP is sitting on the pivot; a tug-of-war is likely between $1.33 and $1.35.
1H confirms pressure, highlights the squeeze
On 1H, Price/EMAs: Close $1.34 vs EMA20 $1.35, EMA50 $1.35, EMA200 $1.37. Interpretation: intraday trend remains tilted down with layered resistance overhead, with the EMA200 $1.37 looming.
However, RSI(14): 39.71. Interpretation: sellers have the initiative intraday; bounces fade quickly.
Similarly, MACD: line 0, signal 0, hist 0. Interpretation: momentum is flat; the next move likely comes via a volatility expansion rather than a steady grind.
Moreover, Bollinger Bands: mid $1.35, upper $1.37, lower $1.34. Interpretation: price is hugging the lower band; any rejection from $1.35 keeps pressure on $1.33.
As a result, ATR(14): $0.01. Interpretation: very tight intraday range; expect a pop once liquidity builds on one side.
Therefore, 1H pivot levels: PP $1.34, R1 $1.35, S1 $1.34. Interpretation: micro-balance at $1.34; a clean push through $1.35 is needed to shift tone.
15m execution context: micro coil
On 15m, Price/EMAs: Close $1.34 vs EMA20 $1.34, EMA50 $1.35, EMA200 $1.35. Interpretation: price is pinned under the slower MAs while riding the fast EMA; micro upticks meet supply.
In turn, RSI(14): 40.54. Interpretation: slight bearish tilt; no capitulation, no real bid.
Likewise, MACD: line 0, signal 0, hist 0. Interpretation: no edge from momentum; trade location matters more than signals.
Additionally, Bollinger Bands: mid $1.34, upper $1.35, lower $1.34. Interpretation: bands are squeezed; a break of $1.35 or $1.33/$1.34 likely sets the next short-term leg.
Even so, ATR(14): ~$0.00. Interpretation: ultra-quiet; stops can be tight, but whipsaws can be sharp when the coil releases.
Accordingly, 15m pivot levels: PP $1.34, R1 $1.34, S1 $1.34. Interpretation: micro pivots stacked at the same price underscore the stalemate.
Trade logic from here
In brief, Bias: Daily structure is bearish. However, hourly and 15m show volatility compression near support, so a bounce can happen, but it remains counter-trend unless the daily reclaims key levels.
Bullish scenario
A squeeze through $1.35 that holds, then $1.36, opens a run toward the daily mid-band near $1.40. The higher-conviction shift comes only if the daily closes back above the EMA20 at $1.38, turning near-term pullbacks into buys rather than sells.
Invalidation: a failure to hold above $1.35 on retests, or a daily close back under $1.33 that drags price toward the lower band at $1.31. That would confirm the bounce as a mere relief move in a downtrend.
Bearish scenario
Conversely, a clean break under $1.33 exposes the lower band at $1.31. If $1.31 gives way on a closing basis, expect momentum to pick up as stops trigger and the volatility compression resolves lower.
Invalidation: reclaiming and holding $1.38 (daily EMA20) with H1 momentum flipping (RSI back above 50 and a positive MACD histogram). That would neutralize the immediate downside and shift the focus to $1.40–$1.49.
Positioning, risk, and uncertainty
With today’s Ripple price pinned at the pivot and volatility squeezed, patience is an edge. In practice, let price show acceptance above $1.35–$1.36 for longs or below $1.33 for shorts, and keep risk tight given the small ATR — the first break is likely to run.
Moreover, broader conditions (high BTC dominance and a Fear reading) favor defensive positioning, so respect the bearish daily structure until the chart reclaims it. The clean trades are at the edges: $1.33–$1.31 on the downside and $1.35–$1.38 on the upside. Volatility is suppressed; when it wakes up, expect slippage and wider spreads for a period.
In sum, volatility is compressed and structure stays bearish until key daily levels are reclaimed; the next directional move should extend once the range finally breaks.
