




With risk appetite weak (Fear index 34) and BTC dominance at 58%, Ethereum price today sits near $2,096 under all major daily MAs as sellers fade every bounce.
Summary
Market overview
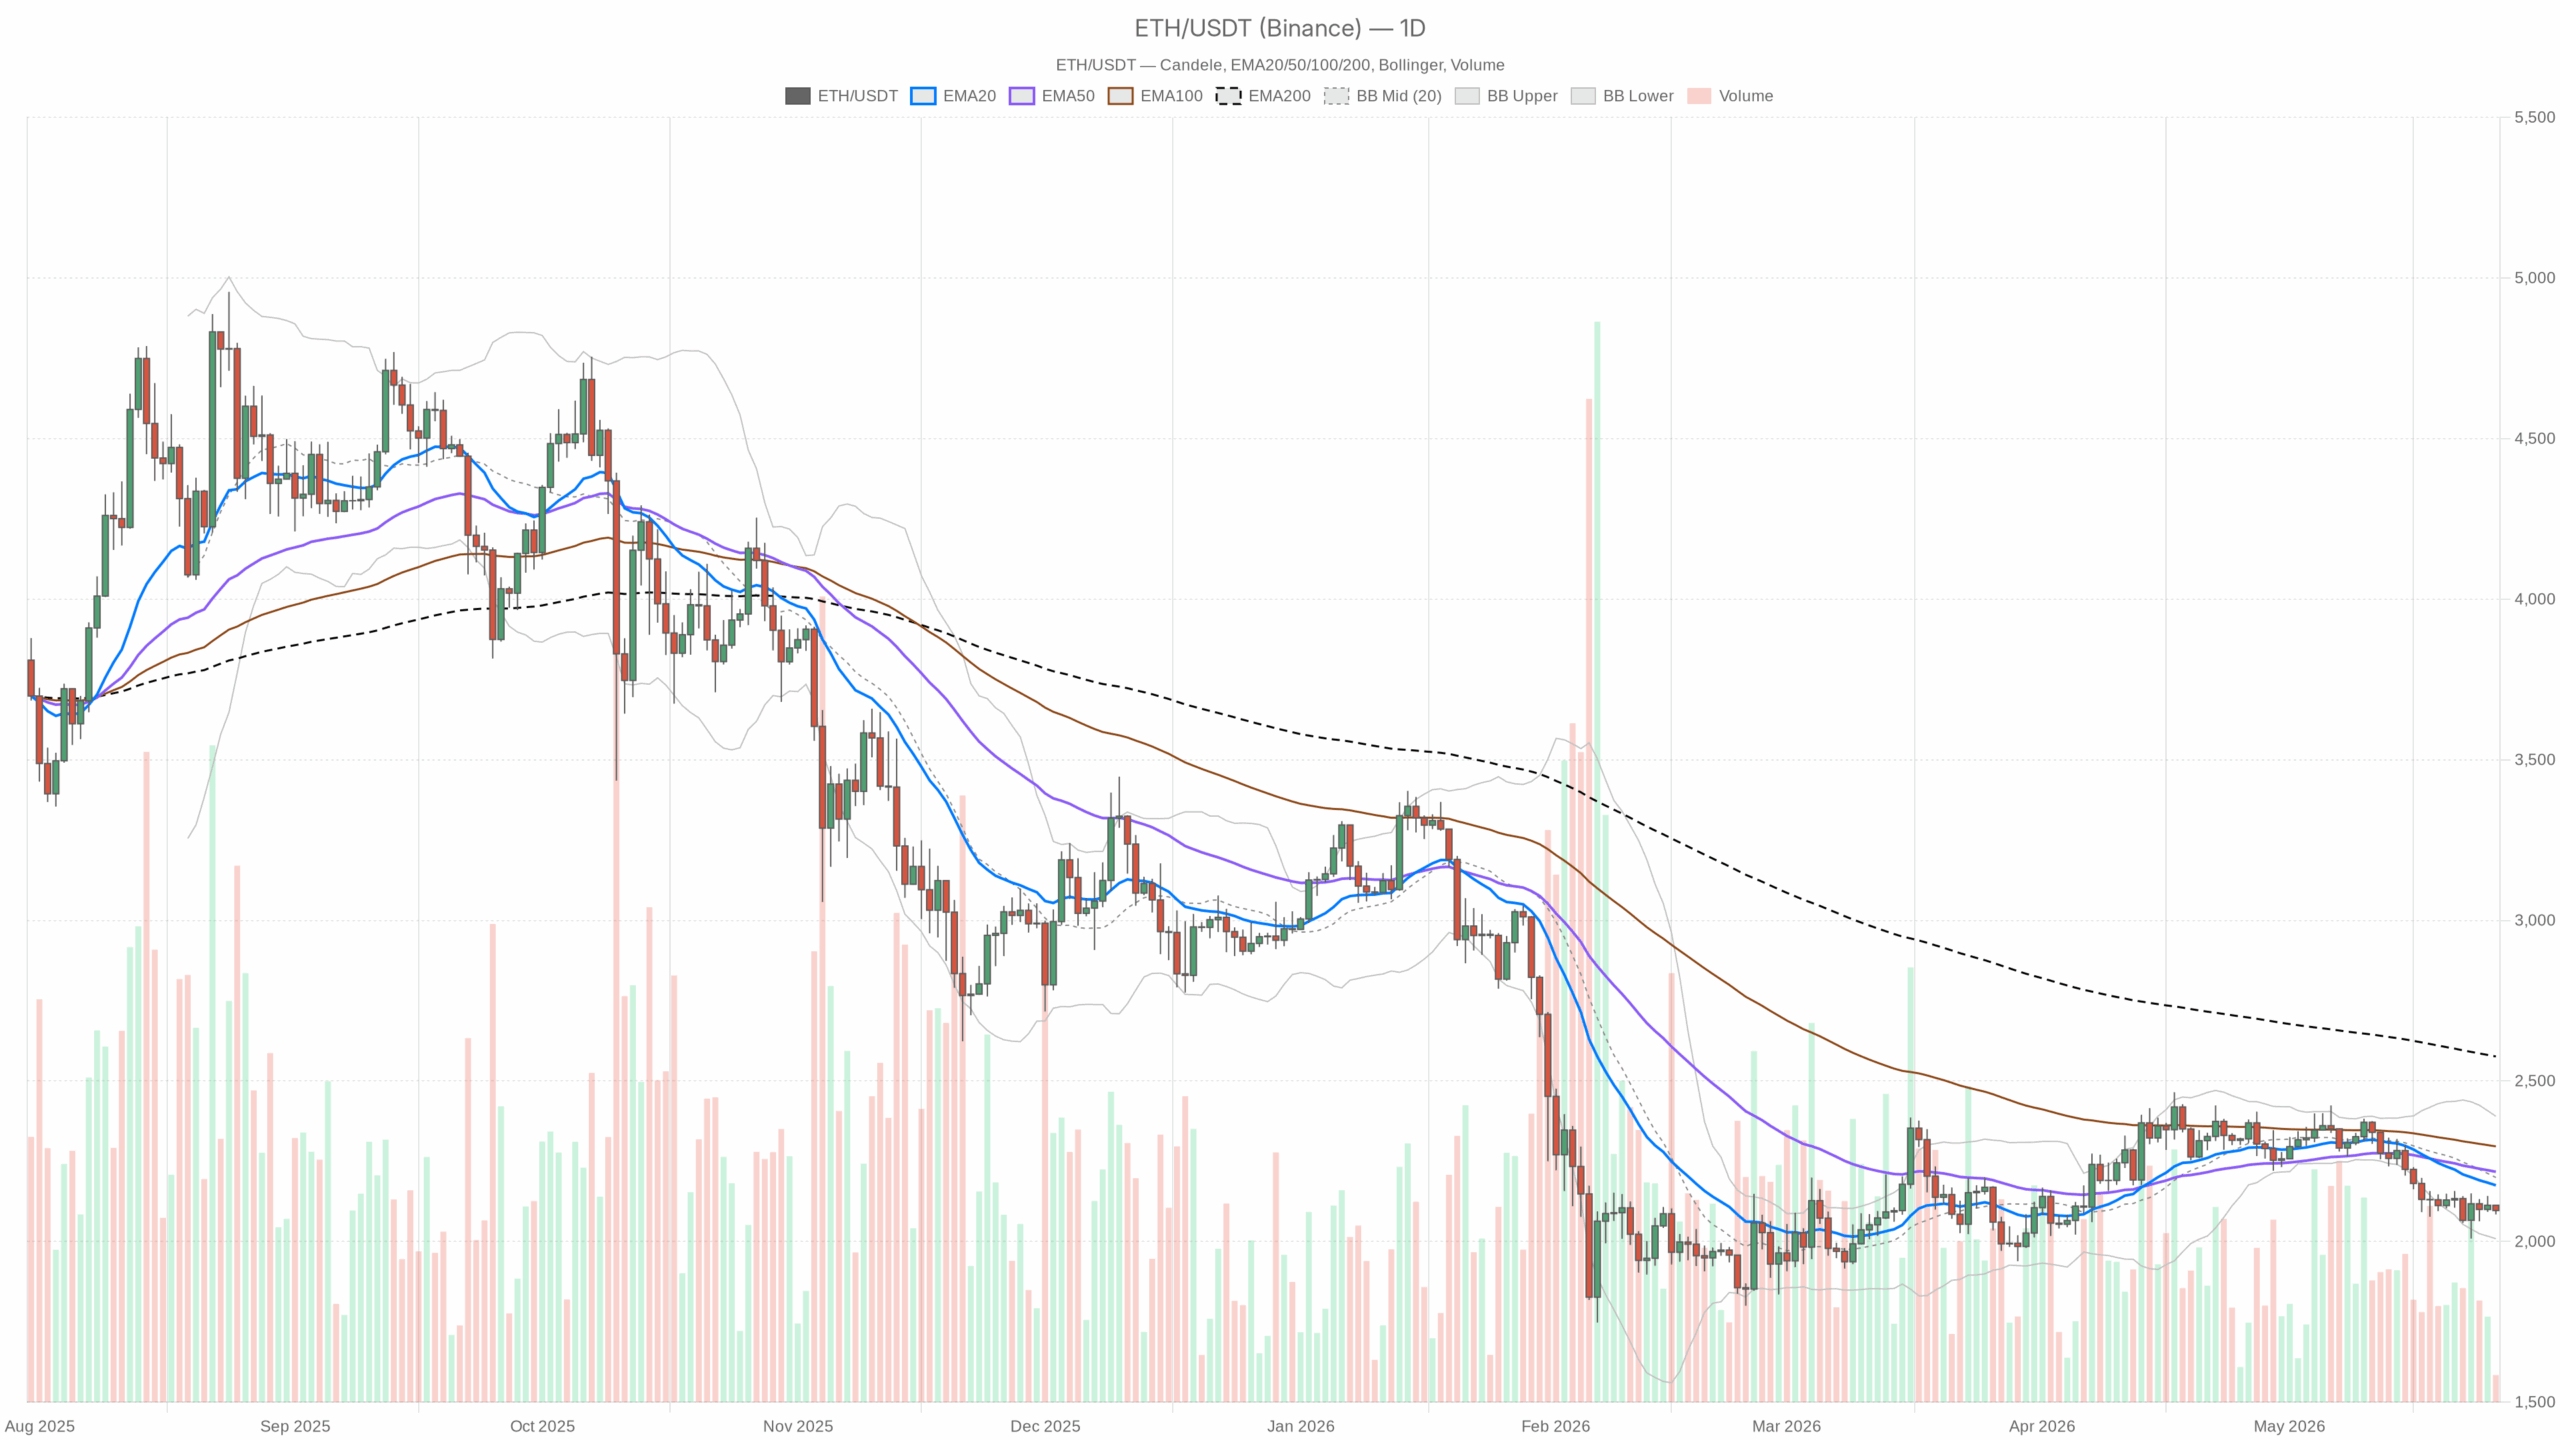
As of May 26, 2026, ETH trades heavy beneath every major daily moving average and presses the lower half of its daily Bollinger envelope. Moreover, repeated probes into $2.10k–$2.15k meet supply, keeping rebounds shallow.
Market logic: The daily trend is down, so mean‑reversion bounces are guilty until proven otherwise. Momentum is negative and structure bearish, placing the burden on buyers to reclaim levels. However, intraday attempts to stabilize remain below key hourly moving averages; until those are regained, the path of least resistance is lower or sideways.
Multi‑timeframe read
Daily (macro bias): Bearish. Price ($2,096) sits below the 20D/50D/200D EMAs with RSI in the high‑30s and MACD negative. That is a weak tape with room to test the daily lower band near ~$2,009. Any bounce into $2,150–$2,200 likely meets supply unless buyers flip the 20D EMA at $2,175.
1H (confirmation): Bearish. Meanwhile, ETH trades below the 20/50/200‑hour EMAs, with the hourly pivot (~$2,096) acting as a ceiling and first support layered at $2,090 and $2,082. Momentum is negative but not accelerating, which keeps the door open to choppy fades rather than clean trend breaks.
15m (execution context): That said, a minor positive turn in the MACD histogram hints at a micro bounce, but price is still under the 15m EMA stack. Into $2,097–$2,102 is where short‑term sellers have been reloading; reclaiming and holding above $2,105 would be the first sign that the bounce has teeth.
Indicator evidence (with takeaways)
- RSI (Daily 14): 37.79 — Weak but not washed out; pressure favors sellers, yet it is not capitulation territory, so bounces can be faded until RSI reclaims the low‑40s/50.
- MACD (Daily): line −51.56, signal −41.23, hist −10.33 — Negative momentum persists; the sell impulse remains intact, and bulls have not produced a convincing turn.
- EMAs (Daily): 20D 2,175; 50D 2,217; 200D 2,576 — Price below all three defines a downtrend regime; these levels are overhead supply and reference points for rallies to fail unless decisively reclaimed.
- Bollinger Bands (Daily): mid 2,199; lower 2,009; price 2,096 — Near the lower band, which often invites mean reversion, but in downtrends tags can walk the band; respect the risk of a grind toward ~$2,009.
- ATR (Daily 14): $74.55 — Typical day range near 3–4% of price; expect whipsaws around intraday levels and size positions accordingly.
- Pivots (Daily): PP 2,098.28; R1 2,112.03; S1 2,082.66 — Trading just under PP turns that level into immediate resistance; S1 marks the near‑term line where dip‑buyers might try again.
- 1H context: EMAs (20/50/200) at 2,105/2,106/2,125; RSI 43; MACD histogram slightly negative — Intraday trend is down; upside attempts likely stall into 2,102–2,106 unless momentum flips.
- 15m context: EMAs 2,097/2,102/2,104; RSI 46; MACD hist +0.62 — Early bounce attempt, but below the bigger hourly averages it is a counter‑trend move until proven otherwise.
That said, Ethereum price today remains constrained by supply into $2.10k–$2.15k. Rallies toward $2,150–$2,200 likely stall unless the 20D EMA near $2,175 is reclaimed.
Levels and scenarios
Bullish path (counter‑trend for now): Hold $2,090–$2,082 and reclaim $2,102–$2,106 (hourly R1/EMA20/EMA50). Acceptance above $2,125 (1H EMA200) could open a squeeze into $2,150–$2,160. The stretch target is the daily 20EMA near $2,175, where bigger sellers likely wait. Invalidation: an hourly close below $2,082 that sticks, or a daily close pressing the lower band (~$2,009) without responsive demand.
Bearish path (dominant): Alternatively, failures under $2,100–$2,106 keep rallies capped. A break below $2,090 and $2,082 invites a push toward $2,050, then the daily lower band and round figure $2,010–$2,000. If fear lingers and BTC dominance stays elevated, a liquidity sweep into $1,980–$1,995 is plausible. Invalidation: sustained hourly acceptance above $2,125, or a daily close back above $2,175 that flips the mean‑reversion dynamic in favor of buyers.
How to think about positioning
The bias is short or underweight until ETH can reclaim and hold the $2.10k–$2.125k cluster. Otherwise, treat bounces as opportunities to reduce risk rather than chase. Moreover, if you trade the micro swings, the 15m hints at a small bounce. Still, respect the hourly downtrend and the ~$75 daily ATR; levels will get tested and retested.
Additionally, keep an eye on $2,082 as the immediate battleground; losing it cleanly puts the lower band in play, while recapturing $2,125 starts to neutralize the tape. Volatility is moderate and the market tone cautious. Consequently, expect chop around intraday pivots, widen stops relative to ATR if you participate, and be explicit about invalidation.
Overall, the setup skews bearish into $2.10k–$2.15k resistance with downside risk toward $2,009–$2,000 unless $2,125 and then $2,175 are reclaimed decisively.
