

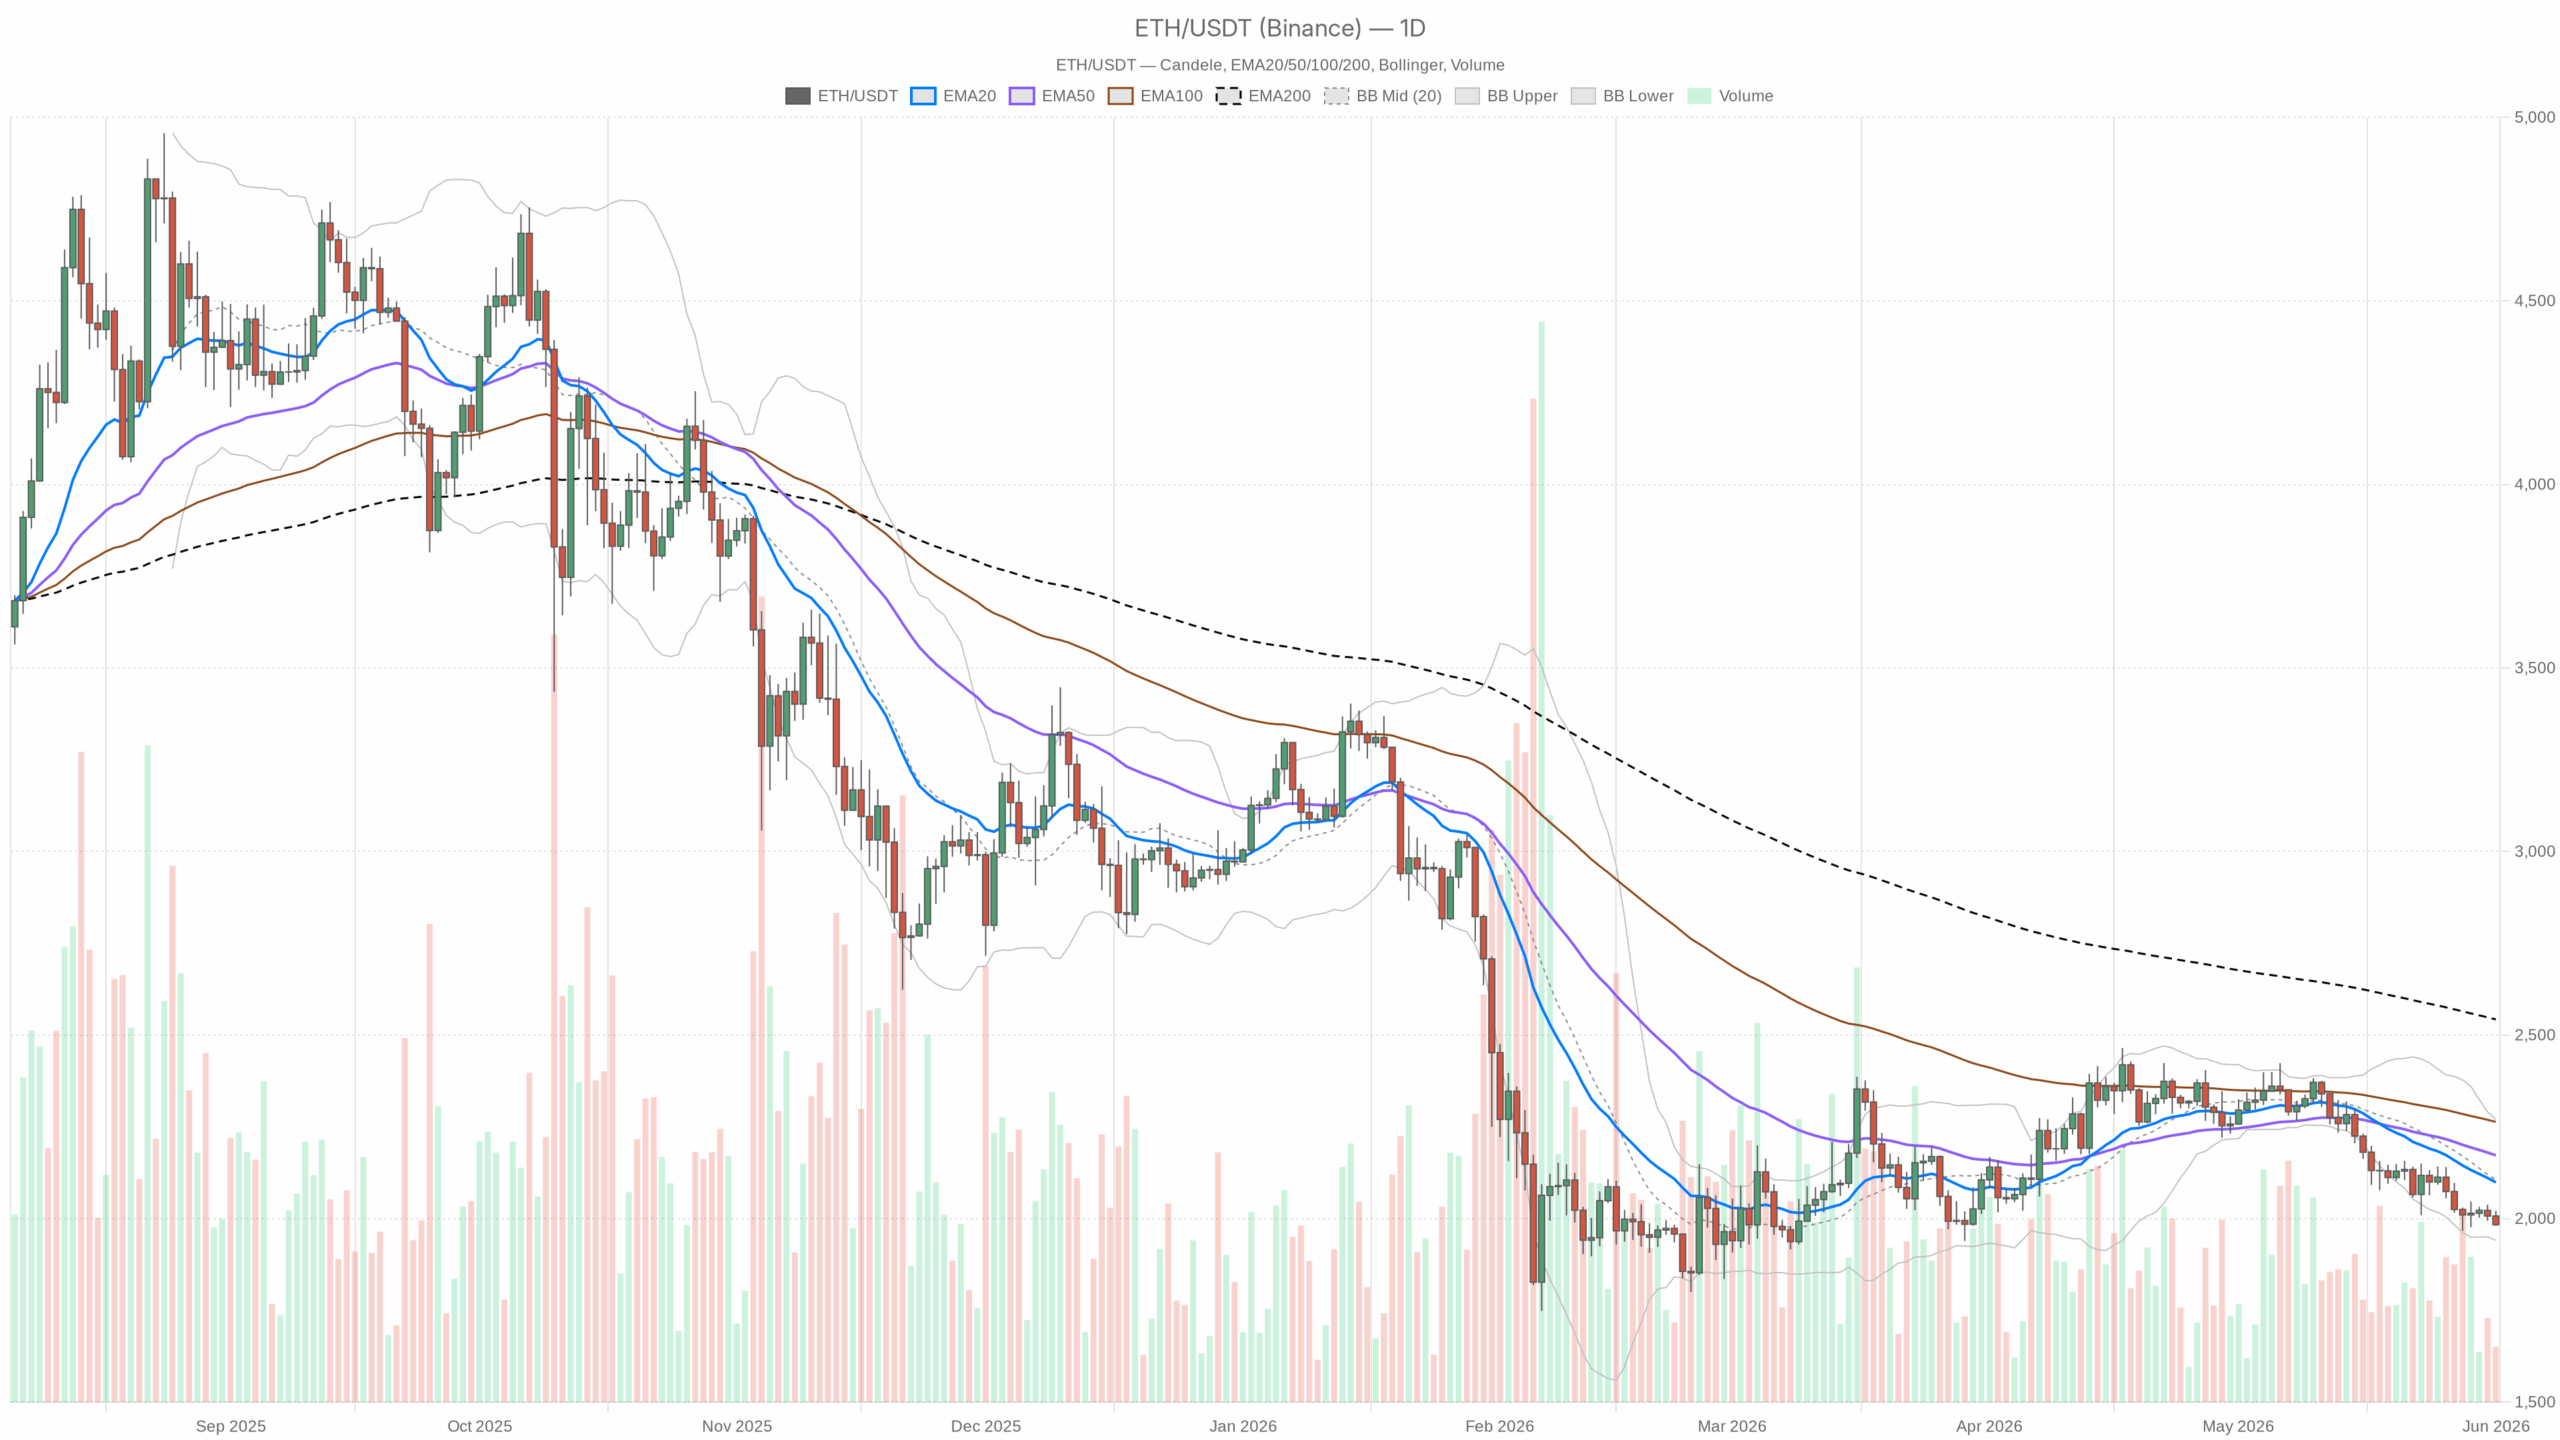
In risk-off trading, with fear at 29 and Bitcoin dominance above 57%, Ethereum price today sits near $1,983 under $2,000, printing lower highs and pressing the daily volatility band’s lower edge.
Summary
Market logic
Daily momentum is bearish, yet the tape looks stretched. Price rides the lower side of its bands, and the daily RSI has slipped into oversold. Either we see a reflex pop toward $2,000–$2,050, or ETH walks the band lower into the mid-$1,900s. However, trend persistence remains the dominant force, with only a tactical mean-reversion bid competing.
As of 1 June 2026, the Fear & Greed Index stands at 29 and Bitcoin dominance is above 57%, keeping flows defensive. In that context, Ethereum price today likely stays capped below $2,000 unless intraday momentum flips and holds.
Daily chart (macro bias: bearish)
- EMAs: Price $1,983 is below the 20D $2,098, 50D $2,172, and 200D $2,543. Interpretation: firm downtrend; rallies toward the 20D are likely to meet supply until proven otherwise.
- RSI (14): 29.9. Interpretation: oversold territory—room for a relief bounce, but oversold can persist in a trend day.
- MACD: Line −68.3 under signal −59.2, histogram −9.1. Interpretation: bearish momentum still engaged; no confirmed bullish turn yet.
- Bollinger Bands: Mid $2,105, lower $1,940, upper $2,271; price near the lower side. Interpretation: hugging the band increases continuation risk lower, but it also sets snapback potential toward the mid-band on short-covering.
- ATR (14): ~$65. Interpretation: typical daily swing is around 3% of spot; a clean break can run that distance without being unusual.
- Pivots: PP $1,994.9, R1 $2,009.8, S1 $1,968.4; price sits between PP and S1. Interpretation: sellers hold the tape while above S1; losing S1 risks a push toward the band low ($1,940).
1H chart (confirms weakness)
- EMAs: Price below 20H $2,004.7, 50H $2,012.7, 200H $2,043.1. Interpretation: intraday trend down; bulls need to reclaim ~$2,005–$2,013 to even neutralize momentum.
- RSI (14): 34.3. Interpretation: weak, not washed out—room to bleed unless a catalyst lifts it.
- MACD: Line −7.3 below signal −5.2, histogram −2.1. Interpretation: downside momentum still active on the hour.
- Bollinger Bands: Mid $2,005, lower $1,985; price fractionally below the lower band. Interpretation: stretched on the downside; a bounce back to the mid-band can happen without changing trend.
- ATR (14): ~$14.4 per hour. Interpretation: intraday swings of $10–$20 are par for the course; plan entries with that noise in mind.
- Pivots: PP $1,985.2, R1 $1,988.3, S1 $1,979.9. Interpretation: hovering just under PP, with S1 acting as the immediate line in the sand.
15m chart (execution context)
- EMAs: Price under 20/50/200 on 15m (20mA ~$1,994). Interpretation: micro trend points lower; rallies into $1,994–$2,002 are fade zones unless 15m closes stack above.
- RSI (14): 34.3. Interpretation: weak, but not capitulated—allows for orderly grind or quick pops into resistance.
- MACD: Negative and under signal. Interpretation: sellers still pressing on the very short-term tape.
- Bollinger Bands: Mid $1,997.5, lower $1,977.1. Interpretation: price sits closer to the lower band; any bounce likely targets the mid first.
- ATR (14): ~$6.3 per 15m bar. Interpretation: local noise of $5–$7; use it to size stops if you’re trading the micro.
- Pivots: PP $1,983.5. Interpretation: price is hovering around this pivot; flips above and holds favor a test of $1,990–$2,000.
Scenarios
Bullish path (tactical bounce): Defend the $1,968–$1,941 zone (daily S1 to daily lower band) and push back above $1,985 → $2,000. Acceptance over the hourly mid-band/EMA20 around $2,005 and then $2,010–$2,020 would open a move toward $2,070 and the daily 20EMA near $2,099. Stretch targets on a stronger squeeze sit near $2,172 (daily 50EMA). Invalidation: a decisive break and daily close below $1,941 would undercut the bounce case.
Bearish path (trend continuation): Failures into $1,985–$2,005 keep pressure on $1,968. A clean break of $1,968 exposes the band low at $1,940. Below there, the next magnet is the round $1,900 area. A typical daily follow-through of roughly one ATR (~$65) is entirely feasible. Invalidation: sustained reclaim and hold above $2,010–$2,020 on the 1H, and especially a daily close back above ~$2,095–$2,100 (near the 20D EMA), would unwind the immediate bearish setup.
Positioning, risk, and uncertainty
We are in a bear regime with oversold readings—good hunting ground for countertrend traders, hazardous for late shorts. For trend participants, the higher-probability play is selling rallies into the $2,000–$2,015 pocket while the 1H stays below its 20/50 EMAs. That said, for countertrend attempts, keep sizes modest, demand reclaim-and-hold behavior above intraday pivots, and respect the daily ATR when setting risk. With fear elevated and BTC dominance high, liquidity can thin around round numbers, making wicks common. Therefore, be ready for volatility and avoid anchoring to a single outcome; the first hour above or below today’s pivots will likely set the tone.
In summary, bears control below $2,000; monitor $1,968 and $2,010–$2,020 for direction while daily momentum stays bearish and the volatility bands guide the path.