

Amid a risk-off rotation, Chainlink price today is pinned near $9, with crypto breadth weak and follow-through lacking. Sellers keep fading bounces as dominance shifts toward Bitcoin.
Chainlink (LINK) is pinned at $9.00 today, hugging the lower half of its recent range while crypto breadth softens. Meanwhile, the dominant force is a risk-off rotation rather than idiosyncratic flow. As of June 1, 2026, Bitcoin dominance sits near 57% and the Fear & Greed Index is stuck in Fear (29). In that backdrop, altcoin rallies are starved of follow-through, and sellers dictate the tape on each push.
This moment matters because Chainlink price today is sitting on the edge of daily support while volatility is compressed intraday. Either we get a measured mean-reversion pop into overhead supply (and fade it), or a clean slip through nearby supports that releases a heavier leg down. However, trend is still the boss; bounces must earn their way through stacked resistance.
Summary
Daily sets the bias: bearish
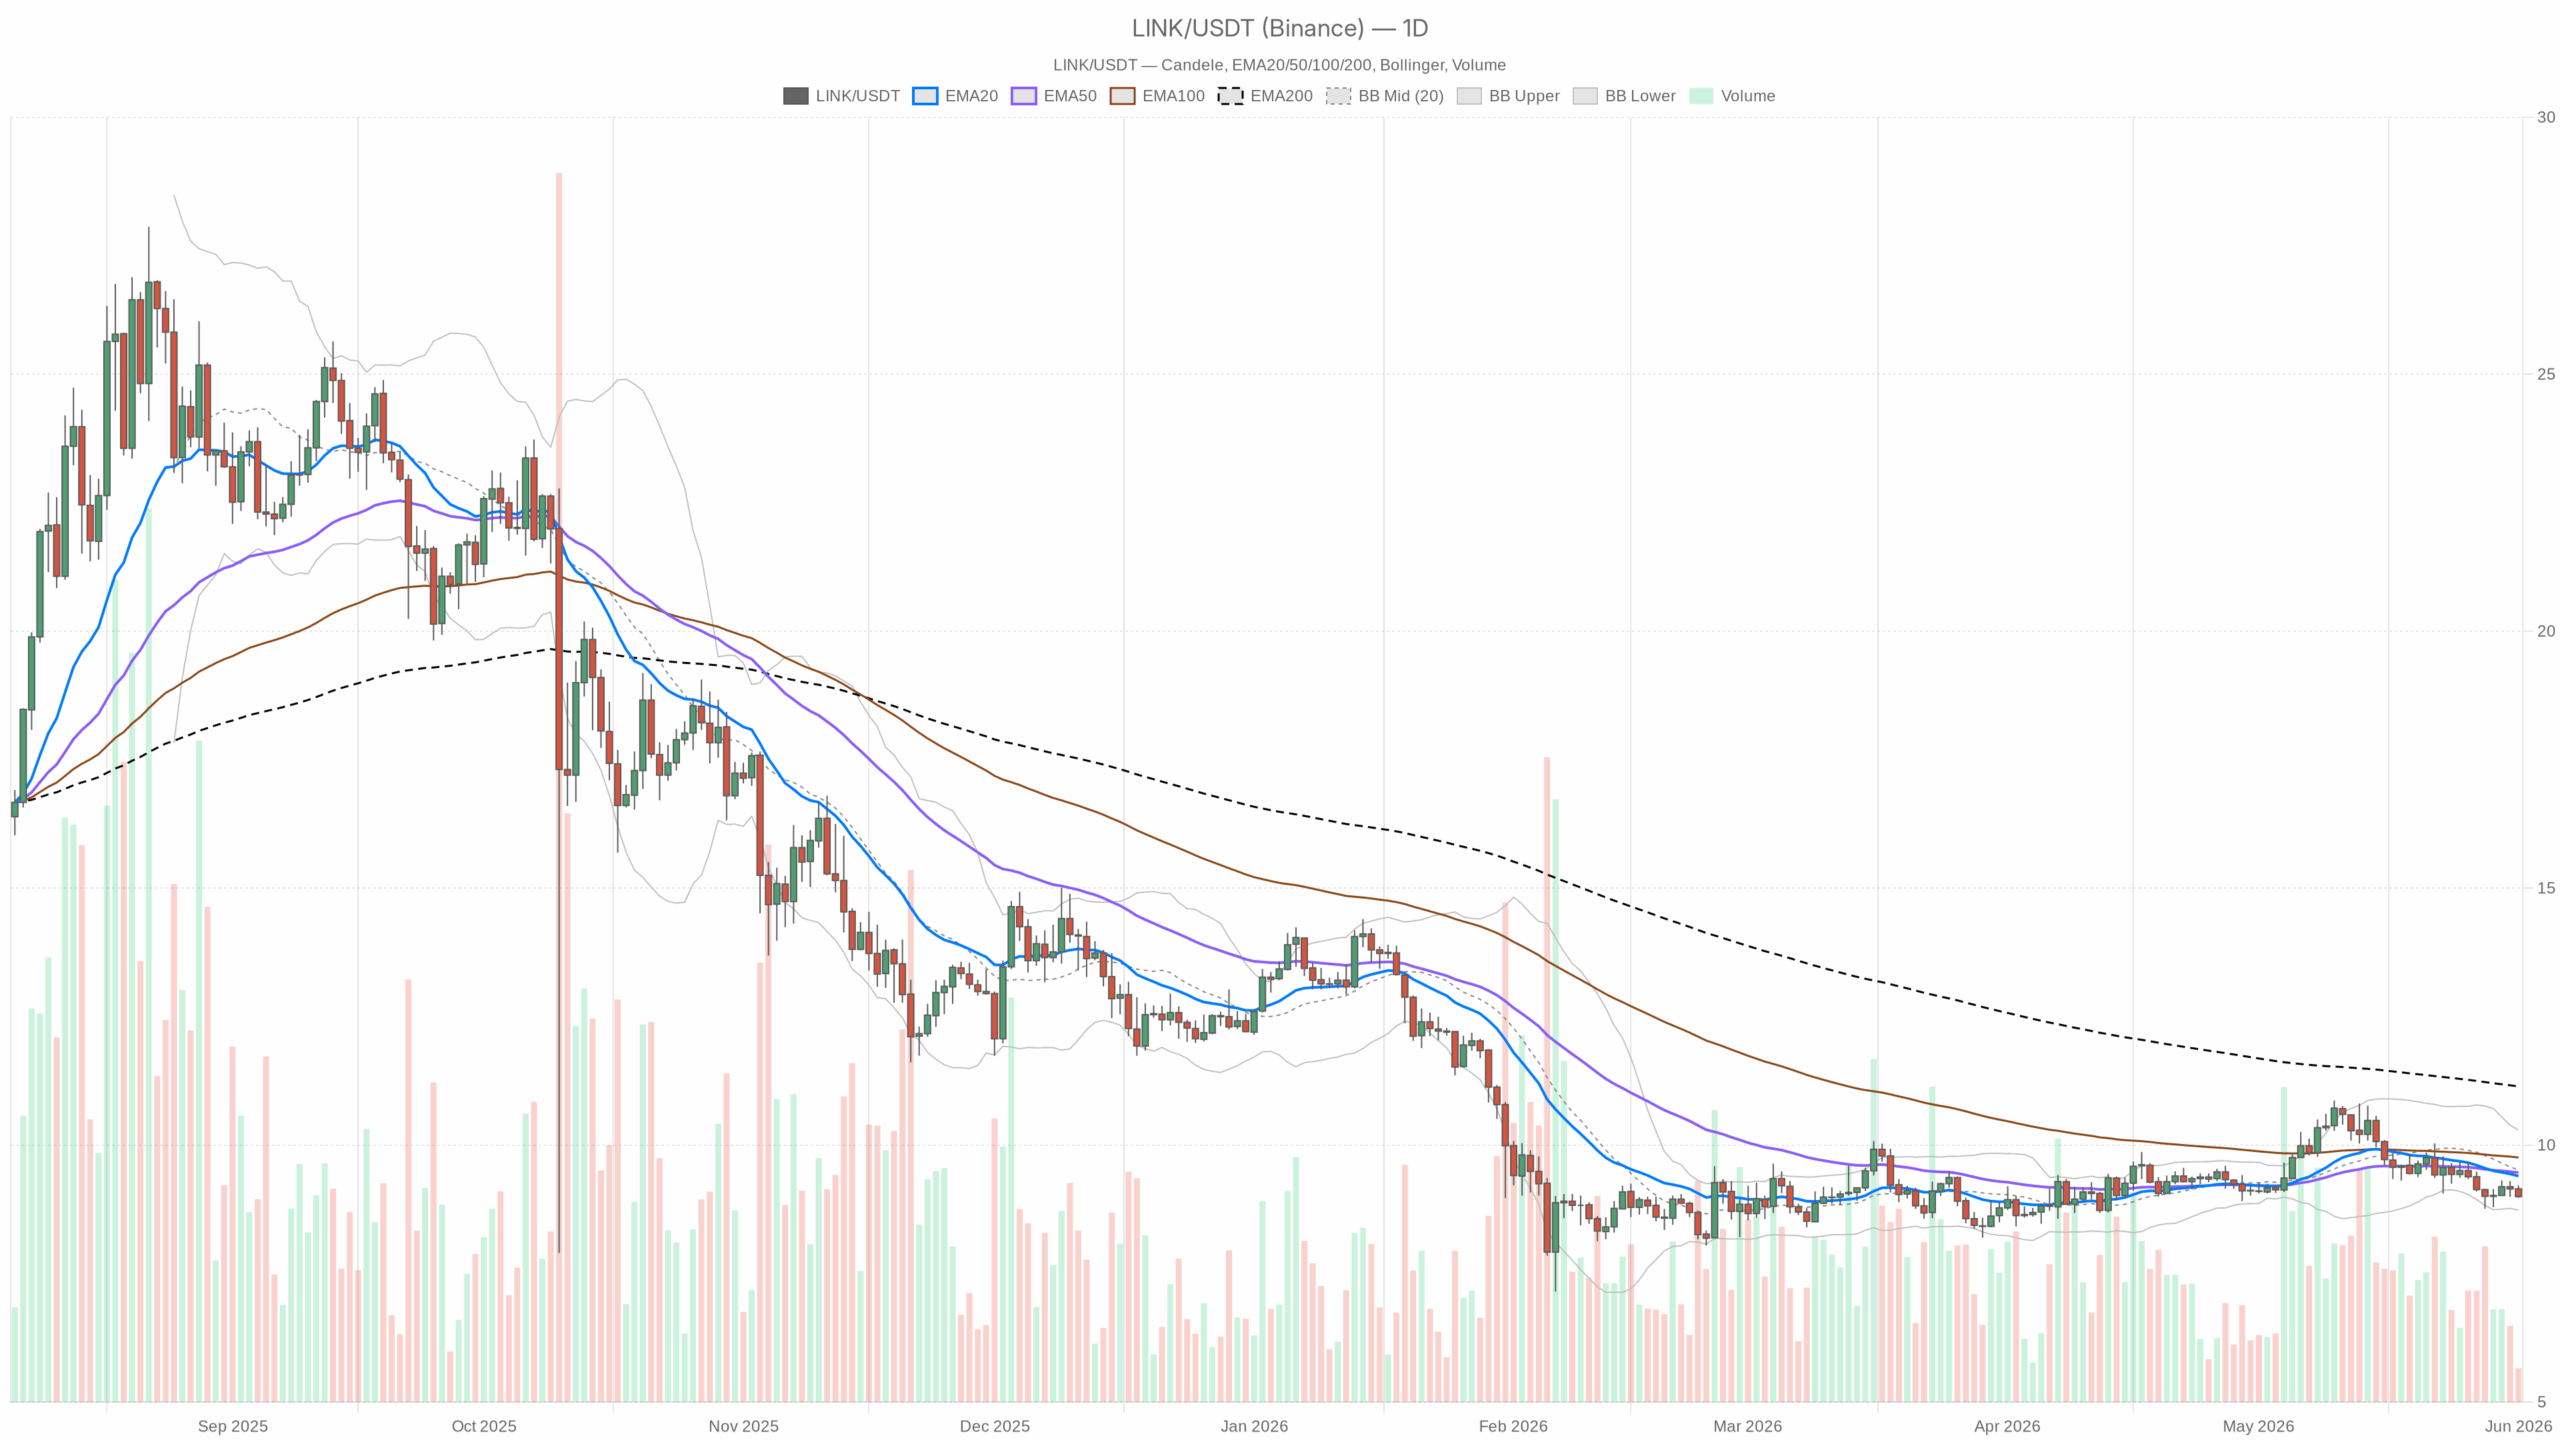
Overall, the daily chart controls the strategic view, and it’s tilted bearish. Momentum is weak, structure is below key moving averages, and price is leaning toward lower Bollinger territory.
- RSI (14): 39.2 — Weak momentum without being washed out; bounces risk being sold until RSI can live back above the mid-40s.
- MACD: line -0.17, signal -0.09, histogram -0.07 — Downside impulse persists; no credible turn yet.
- EMAs: price 9.00 below EMA20 9.40, EMA50 9.47, EMA200 11.14 — Full bearish stack; 9.40–9.50 is the first heavy supply zone.
- Bollinger Bands (20): mid 9.52, upper 10.29, lower 8.74 — Price is in the lower half; there’s room to probe 8.74 before a durable bounce attempt.
- ATR (14): 0.39 — Typical daily swing near 4%; expect ~$0.40 moves around key levels.
- Pivots: PP 9.06, R1 9.15, S1 8.91 — Trading under the pivot; 9.06–9.15 is near-term supply, 8.91 is the first trapdoor.
Intraday check: hourly weak, 15m for execution
Moreover, the lower timeframes don’t contradict the daily; they underline it. Momentum is soft and volatility is tight—conditions that often precede a range break.
1H (confirmation)
- RSI (14): 38.6 — Intraday pressure remains; buyers haven’t taken control.
- MACD: slightly negative — No impulsive turn yet.
- EMAs: price below 20/50/200 (9.11/9.14/9.24) — Bearish alignment; 9.11–9.14 is the gate any bounce must clear.
- Bollinger Bands: mid 9.11, upper 9.23, lower 8.98 — Price pressing the lower rail; range is tight.
- ATR (14): 0.08 — Compressed hourly volatility; a break can expand quickly.
- Pivots: PP 9.01, R1 9.03, S1 8.98 — Pinned near S1; micro-trend still points down.
15m (execution context)
- RSI (14): 37.1 — Micro momentum stays soft.
- MACD: marginally negative — Expect chop with a bearish tilt.
- EMAs: price below 20/50/200 (9.06/9.10/9.13) — Intraday pops likely meet supply into that cluster.
- Bollinger Bands: mid 9.09, upper 9.23, lower 8.95 — Skew is lower; fades favored until the mid-band is reclaimed.
- ATR (14): 0.04 — Very tight; whipsaw risk is high at the round number.
- Pivots: collapsed around 9.00 — Equilibrium sits at $9; breaks can be slippery once it gives.
Scenarios and levels that matter
Bullish path (counter-trend bounce): A reclaim and hold above 9.11–9.15 on the hourly turns the intraday tide and opens a mean-reversion run into 9.40–9.55 (daily EMA20/BB mid). If buyers can close a day above 9.40, the path toward 9.90–10.30 (upper band neighborhood) reopens. Invalidation: failure to hold 9.00 on retests or a daily close back below 8.91 ends the bounce case.
Bearish path (trend continuation): Conversely, a sustained break below 8.91 exposes the lower band at 8.74. With a 0.39 daily ATR, an extension toward ~8.35–8.40 is plausible in a one-session slide if risk-off accelerates. Invalidation: a decisive hourly close above 9.15 followed by a daily close back over 9.40 neutralizes the immediate downside impulse.
Positioning thoughts
That said, Chainlink’s price today sits at a decision zone where trend control meets compressed volatility. With fear elevated and Bitcoin dominance high, respect the risk that alt bounces stall quickly. If engaging, define risk tightly around the 8.91–9.15 band, anticipate volatility expansion from the current squeeze, and plan for failed breakouts around the round number.
In sum, the market remains biased lower while volatility is coiled. Until momentum turns and key daily levels reclaim, rallies look vulnerable and breakdown risk persists. Let the levels lead and adjust exposure as conditions evolve.