
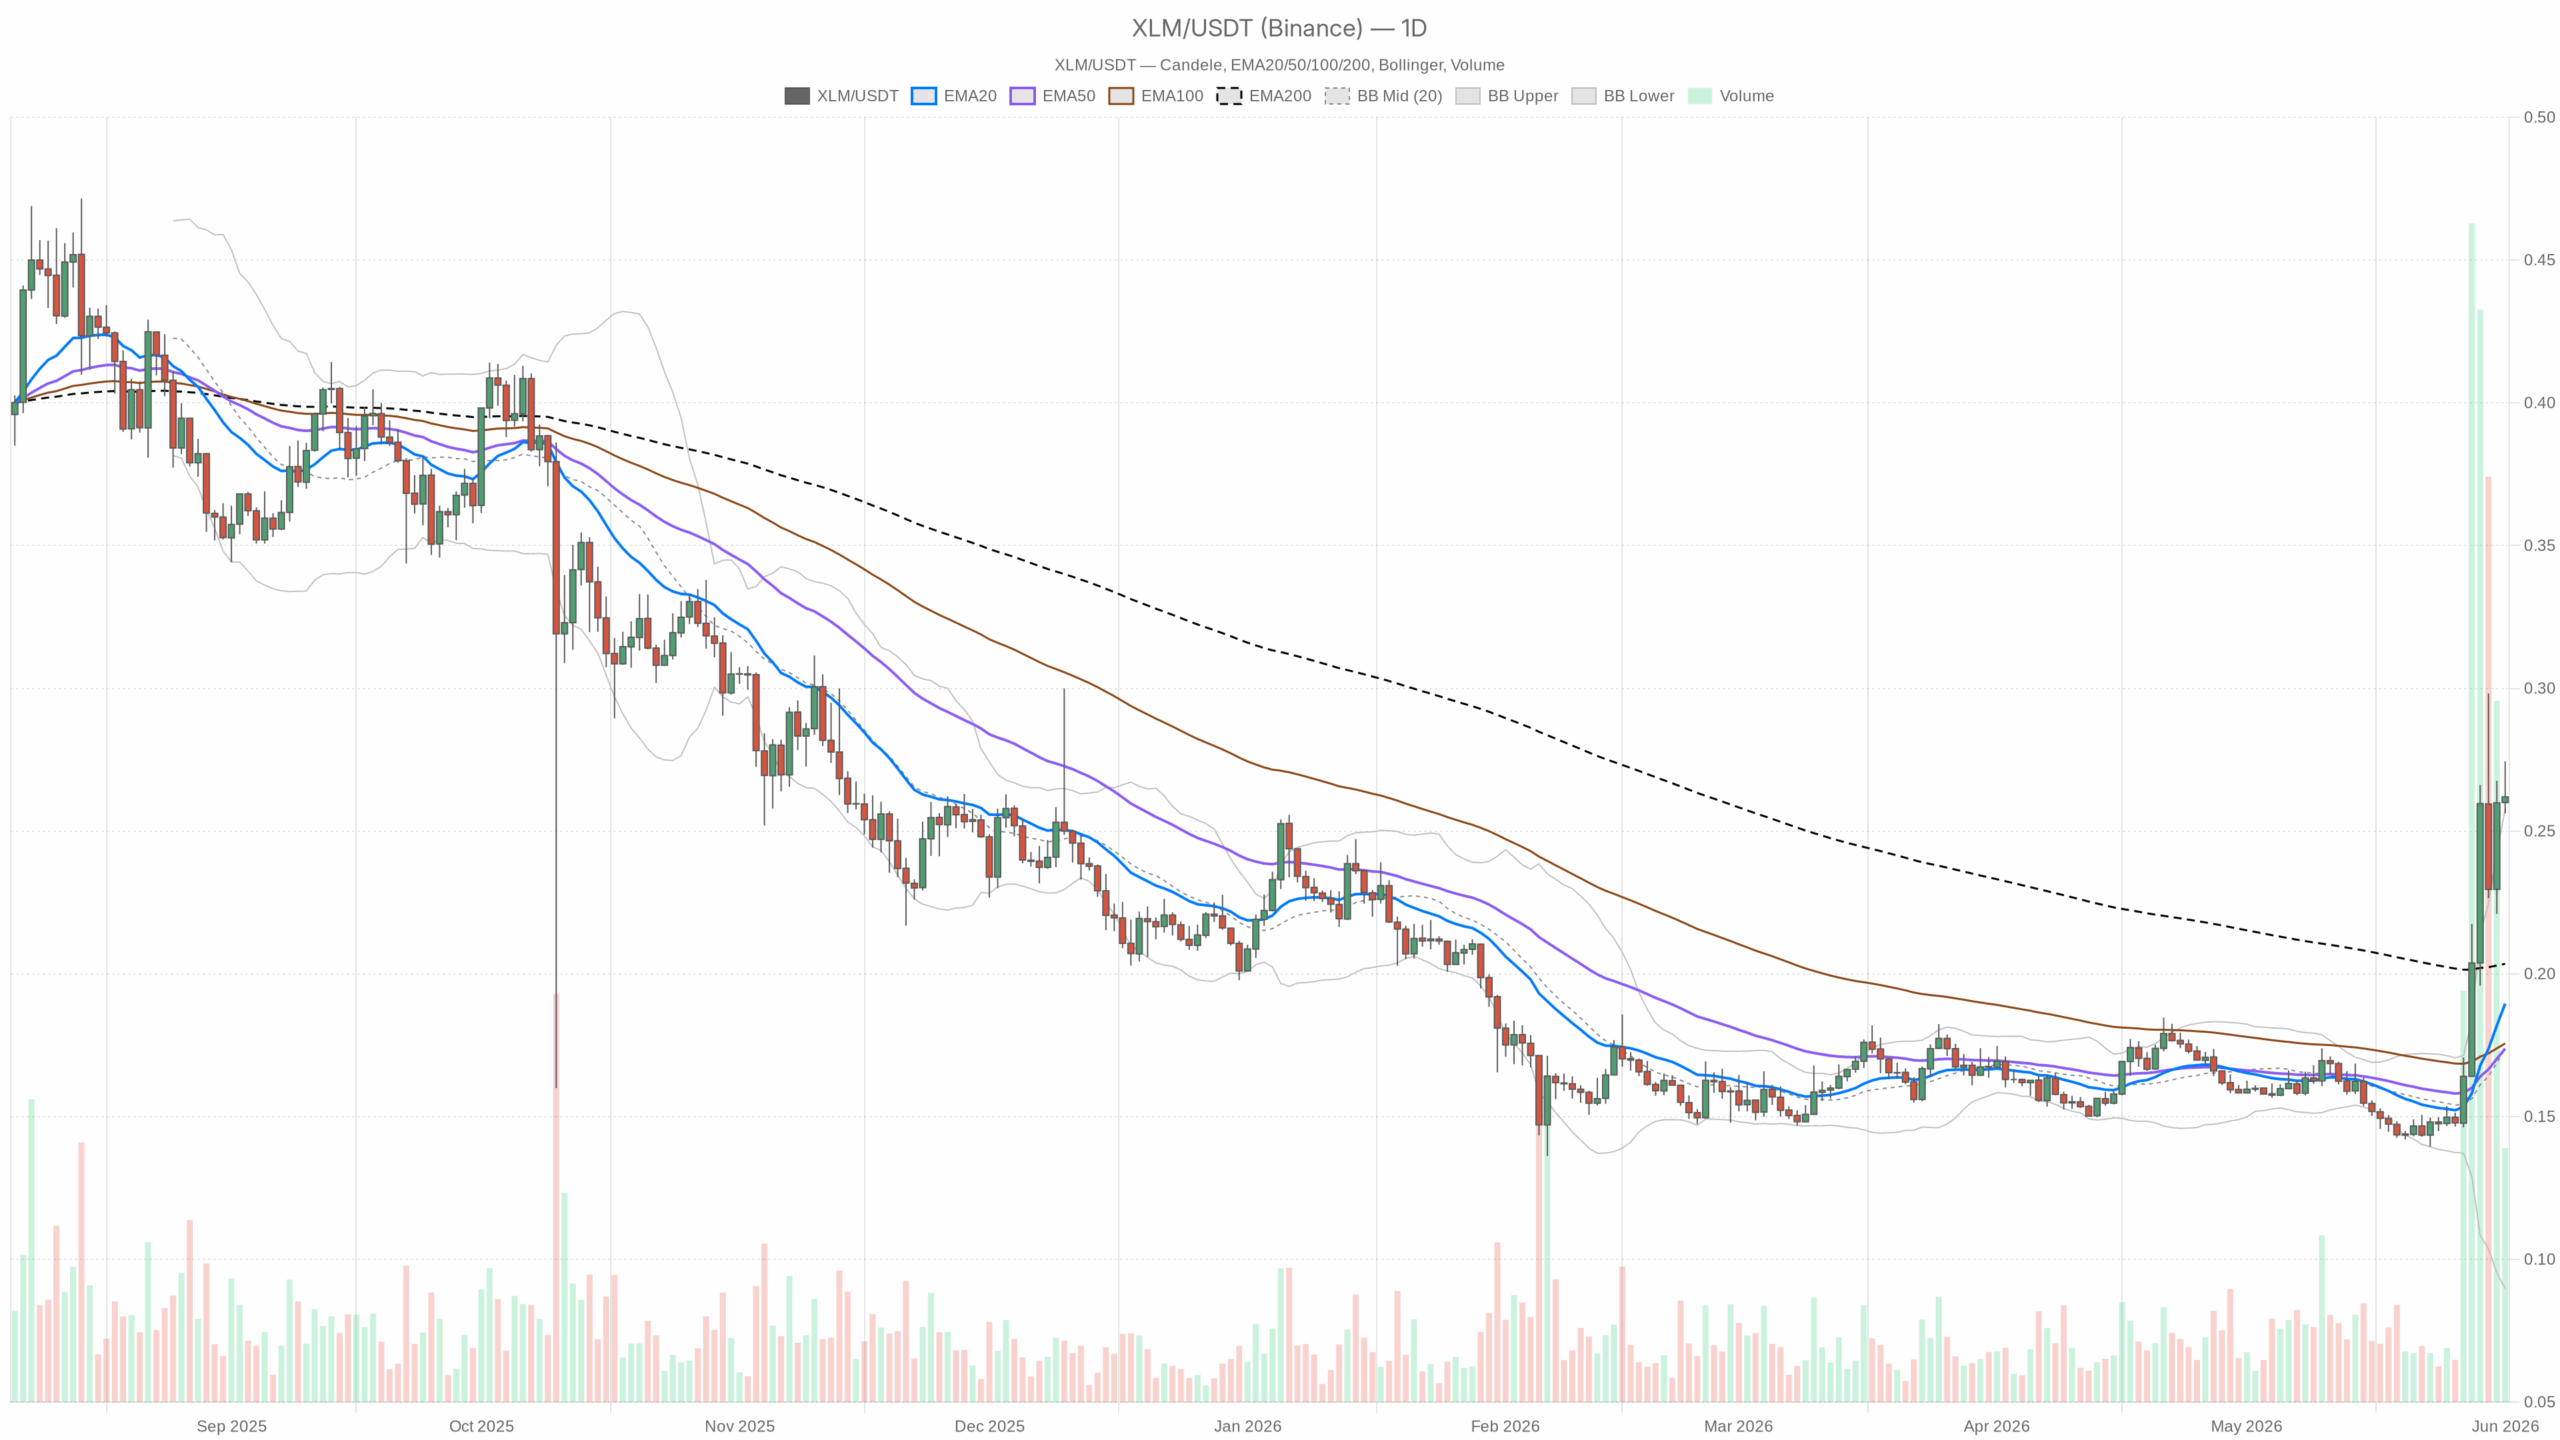
Momentum is in charge as the Stellar price presses the daily upper band near $0.26 after a sharp advance, even while broader crypto remains risk-off with Fear & Greed at 29 and Bitcoin dominance around 57%.
Summary
Main read
Main read: Daily is bullish, but stretched. However, the path of least resistance is higher if $0.26–$0.27 holds, yet overbought conditions increase the odds of a shakeout before continuation.
Market logic
Trends vs. mean reversion: The daily structure favors trend continuation—price is above the 20/50/200 EMAs with positive momentum—yet the Stellar price is tagging the Bollinger upper band, where trends pause or consolidate. Momentum vs. structure: Intraday (1H) momentum is positive but not explosive; the micro (15m) shows compression, which usually precedes a range break. Risk appetite vs. defense: With Bitcoin dominance high and sentiment in fear, alt rallies are fragile. As of 1 June 2026, squeezes can turn into quick give-backs if levels slip.
Daily (macro bias: bullish-but-stretched)
- EMA(20/50/200): 0.19 / 0.17 / 0.20; close = 0.26 — Price sitting well above the stack signals a strong up phase, though the 20EMA still below the 200EMA hints the bigger trend is only recently turning up.
- RSI(14): 75.5 — Buyers are aggressive; risk of a pause or dip rises when momentum is this hot.
- MACD: line 0.02 vs signal 0.01 (hist +0.01) — Upside momentum is active, but not a blow-off; strength with room for wobble.
- Bollinger Bands: mid 0.17, upper 0.26, lower 0.09 — Price kissing the upper band reflects extension; continuation is possible, but band-walks often feature shallow pullbacks.
- ATR(14): 0.02 — Roughly ~8% of price per day; volatility is meaningful, so risk sizing needs respect.
- Pivots: PP 0.26, R1 0.27, S1 0.25 — Price sits on the pivot; a decision point where control flips quickly.
1H (tactical confirmation: constructive)
- EMA(20/50/200): 0.26 / 0.25 / 0.21 — Bullish alignment with price hugging the 20EMA; dips to the 50EMA have been bought.
- RSI(14): 55.7 — Positive but with headroom; momentum isn’t maxed out.
- MACD: line 0.01 vs signal 0.00 — Slightly positive; thrust exists but is fading between pushes.
- Bollinger Bands: mid 0.26, upper 0.27, lower 0.24 — Room to probe R1 at 0.27; failure there likely cycles back to mid-band.
- ATR(14): 0.01 — About a cent of intraday wiggle; breakouts can slip and retest quickly.
- Pivots: PP 0.26, R1 0.27, S1 0.26 — Levels are tight; micro support sits just under the figure.
15m (execution context: coiling)
- EMA(20/50/200): 0.26 / 0.26 / 0.25 — Short-term MAs are flat; price is coiling above the 200EMA base.
- RSI(14): 46.3 — Small bearish tilt intraday; buyers are catching breath.
- MACD: near zero — No edge at the micro level; waiting on a trigger.
- Bollinger Bands: mid 0.27, upper 0.27, lower 0.26 — Compressed; expect a volatility expansion soon.
- ATR(14): ~0 — Micro-volatility is dead; first impulse often defines the session.
- Pivots: PP/R1/S1 ≈ 0.26 — Compression underscores the likely breakout nature of the next move.
Scenarios and levels
Bullish case (primary): Hold above $0.26 pivot and punch through R1 at $0.27 on the 1H, then build value above it. A daily close north of $0.27 invites a band-walk and continuation into the high-$0.20s as momentum carries. Invalidation: a daily or multiple 1H closes below $0.25 (S1) that shift 1H RSI back to risk-off behavior.
Bearish case (countertrend/mean reversion): Rejection at $0.27 followed by a loss of $0.25 opens a cleaner retrace. First stop is the $0.25–$0.26 balance; a decisive break targets the higher-timeframe means near the 200EMA/20EMA cluster around $0.20–$0.19. Invalidation: a sustained move and close above $0.27 that keeps 1H momentum firm.
Positioning take
The daily trend in Stellar is up, but it’s a late entry at the upper band in a fearful market. However, tactical longs have the wind at their back while $0.25–$0.26 holds, yet chasing strength carries whipsaw risk. Pullback buys into support or breakout-retest patterns above $0.27 tend to be more forgiving than straight breakouts when RSI is stretched. If $0.25 gives way, think defense first—volatility can expand quickly toward the daily means. Size positions for ~8% daily swing potential and expect fast rotations given the broader risk tone.
Overall, momentum leads while the market tone stays cautious. The setup favors continuation if $0.26–$0.27 holds, but the tape is stretched and vulnerable to shakeouts before trend resumes.