

Lululemon stock is entering one of the most consequential sessions of the year amid clear technical weakness. Trading near $126 after hitting a fresh 52-week low of $124.93 on June 3rd, LULU faces a deeply bearish structural backdrop just before its Q1 earnings release. The daily chart shows a definitive downtrend. The key question is whether earnings can shift this trend or reinforce the current weakness.
Summary
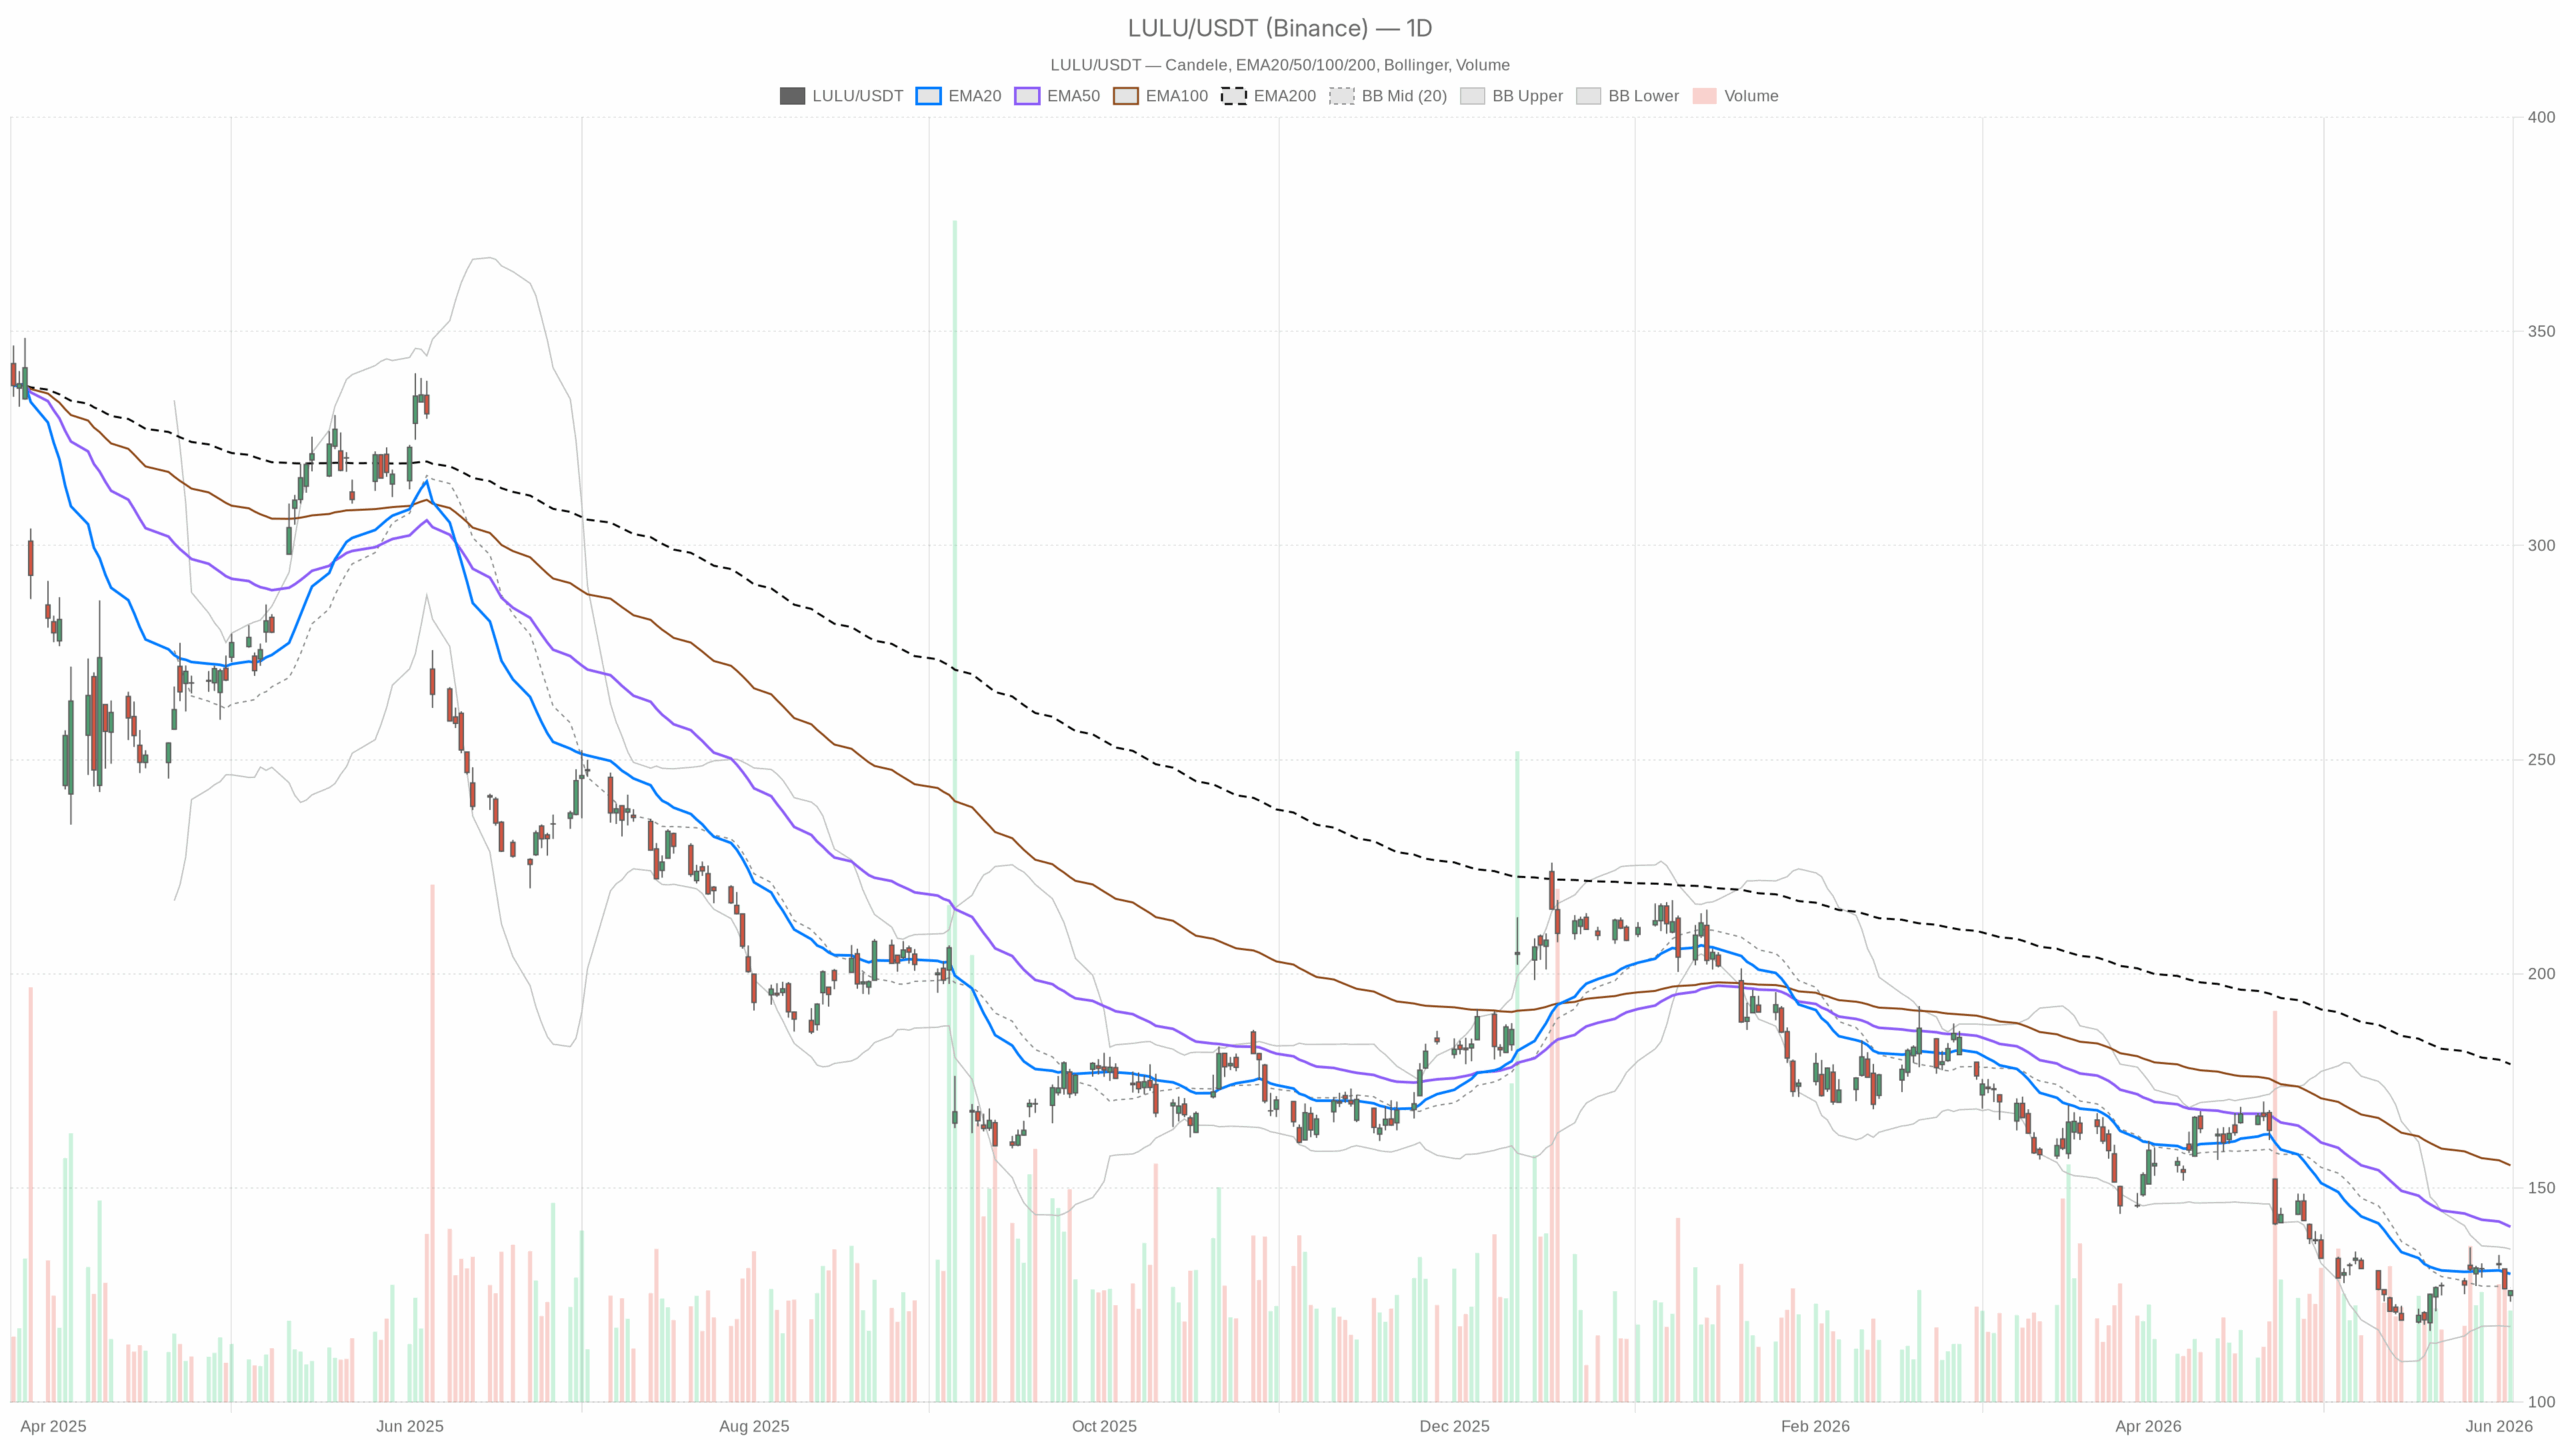
Bearish Technical Structure Weighs on Lululemon Stock
The daily timeframe paints a sobering picture for bulls. Price trades well below the EMA20 at $129.94, EMA50 at $140.95, and EMA200 at $178.91. All major moving averages are above price and sloping lower. This stacking pattern signals sustained distribution over an extended period. The stock has lost about 62% of its value in the past year, with no signs that sellers are exhausted.
Momentum indicators also point sideways to bearish. The daily RSI14 is at 39.27—not yet oversold, but often a prelude to further declines rather than recoveries. The MACD line stands at -3.84 against a signal of -5.39. Importantly, the histogram is positive at +1.55, signaling the decline’s pace is easing but not reversing. This is not a buy signal but reflects moderation in selling pressure.
Volatility and Support-Resistance Levels Heading into Earnings
Bollinger Bands place price near the midpoint at $126.69, with the lower band at $117.66. The stock is neither stretched to the lower band nor recovering toward the upper one; it is drifting without conviction. ATR14 at $4.47 indicates significant daily volatility, which will likely widen around the earnings event. Pivot analysis shows a pivot point at $125.21, resistance at $126.98, and support at $124.27. LULU closed at $126.03, almost at the first resistance level.
Intraday and Short-Term Chart Insights
The hourly chart continues the bearish narrative. Price remains below the EMA20 of $127.43, EMA50 of $128.17, and EMA200 of $132.67. The hourly RSI at 39.32 closely matches the daily reading, confirming no meaningful intraday recovery. The hourly MACD histogram is negative at -0.26 and moving further from zero, reinforcing the bearish outlook.
In contrast, the 15-minute chart shows brief neutrality. The 15-minute RSI has climbed to 52.52, and the MACD histogram turned positive at +0.19. Price trades above the 15-minute EMA20, reflecting only a short-term bounce within a larger downtrend. For tactical traders, resistance near $126.20 and support at $125.81 form a tight range. ATR on this timeframe is just $0.48, indicating contained intraday movement ahead of the earnings catalyst.
Fundamental Factors Adding Complexity Ahead of Earnings
Lululemon is set to report Q1 earnings Thursday after market close. Analysts note current valuations appear cheap after the stock’s sharp decline. However, concerns focus on a possible FY26 earnings reset that could lower forward expectations. The company emphasizes full-price sales, new product launches, and inventory discipline. Whether guidance will restore investor confidence remains the crucial question.
Potential Outcomes for Lululemon Stock Post-Earnings
Bullish Scenario: Positive Earnings Surprise
A favorable earnings report would need to deliver a meaningful positive surprise. Forward guidance suggesting a smaller or avoidable FY26 reset would be key. Technically, a close above the EMA20 near $129.94 would signal a shift in sentiment. The daily MACD histogram’s existing positive divergence could accelerate if the price breaks higher. This scenario targets $135, near the upper Bollinger Band, as a natural technical objective.
Bearish Scenario: Earnings Disappointment or Cautious Outlook
The bearish path remains the easier route given the current structure. Disappointing earnings or cautious FY26 guidance would likely push LULU below the daily support at $124.27 and toward the lower Bollinger Band near $117.66. Closing below the 52-week low already marked a bearish structural signal. The recent lack of demand-side recovery reinforces bears’ control of the market.
Conclusion: Lululemon Stock Faces a Critical Inflection Point
Overall, Lululemon stock stands at a pivotal juncture. The technical structure is bearish on both daily and hourly charts, with trend indicators pointing downward. Yet, the impending earnings release introduces binary risk that no technical setup can fully capture. Volatility is expected to expand significantly, with the earnings report likely triggering moves well beyond the current ATR. Trading positions ahead of this event require clear risk management and conviction. Without a compelling earnings narrative, the technical bias remains strongly bearish.