

Navitas Stock (NVTS) has seen intense market attention recently, driven by an Nvidia partnership. After a remarkable year-to-date rally, the stock is entering a consolidation phase that requires careful analysis and disciplined trading.
Summary
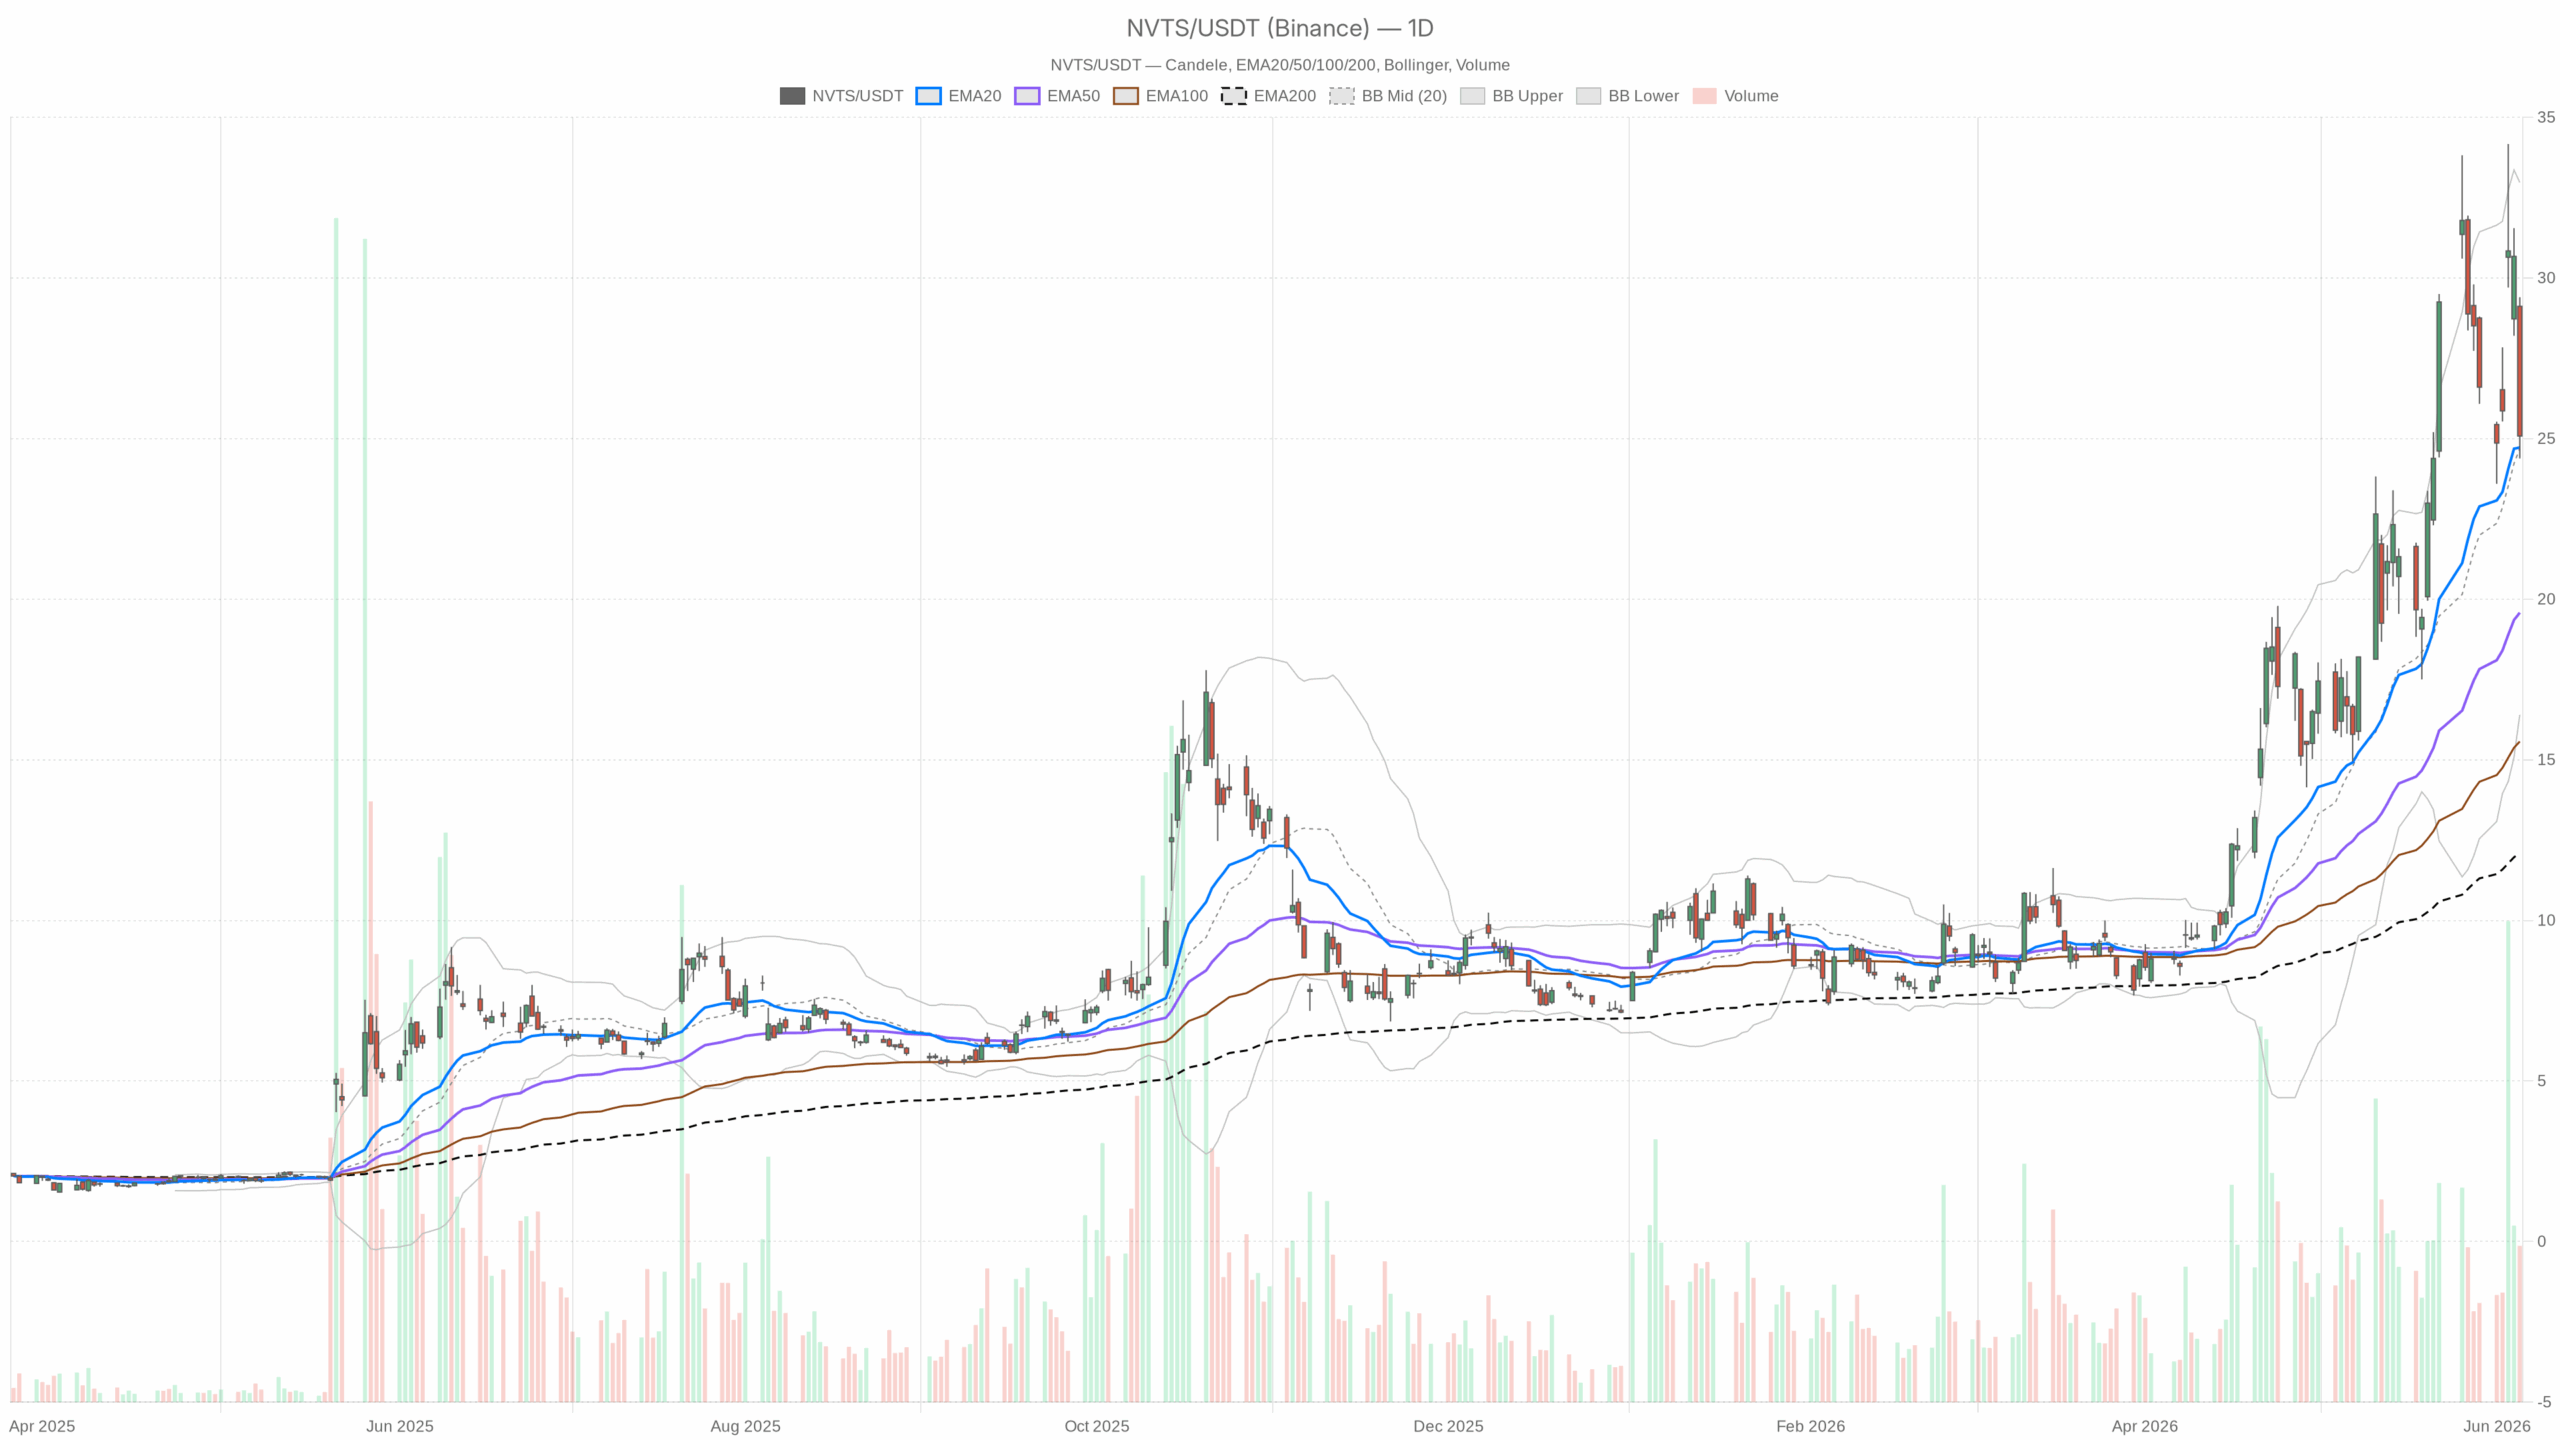
Daily Chart Analysis: Bullish Structure Showing Early Signs of Weakness
On the daily timeframe, NVTS closed at $25.08 on June 5, following an intraday high near $29.40 and a sharp swing down to $24.38. This wide range signals significant volatility and uncertainty at elevated levels. The daily average true range (ATR) near $3.85 confirms the present high volatility, suggesting caution in position sizing.
The exponential moving average (EMA) stack remains supportive on this timeframe. The 20-day EMA at $24.72 lies just below price, with the 50-day EMA at $19.58 and the 200-day EMA at $12.09. Price trading above all rising EMAs reflects a bullish trend. However, the large gap between price and longer-term EMAs indicates elevated mean reversion risk after the rapid advance.
Momentum indicators present a mixed picture. The daily relative strength index (RSI) at 53.38 is neutral to slightly bullish, lacking evidence of overbought conditions. Meanwhile, the moving average convergence divergence (MACD) histogram recently turned negative (-0.15), with the MACD line crossing slightly below its signal line. This subtle crossover signals possible short-term momentum weakening after the prolonged rally.
Bollinger Bands position the price near the mid-band at $24.69, consistent with typical behavior following a volatility spike. The upper band at $32.97 marks the spike zone after the Computex announcement, while the lower band at $16.40 defines the broader trading range floor. Such re-centering suggests that near-term momentum is not currently constructive despite the bullish regime.
Daily pivot analysis shows the pivot point at $26.29, resistance R1 at $28.19, and support S1 at $23.17. The current close below the pivot reflects a bearish posture on daily pivots, with reclaiming $26.29 needed to restore technical confidence in the short term.
Hourly Chart Shows Breakdown of Short-Term Trend
The hourly timeframe portrays a more deteriorated picture. Classified as neutral, signals lean bearish. Price closed at $25.08, well below the 20-hour and 50-hour EMAs at $27.64, which now act as resistance. The 200-hour EMA at $22.85 offers a nearby support floor.
Hourly momentum confirms selling pressure. The RSI is near oversold at 36.13, and the MACD line is significantly below zero (-0.80) with a negative histogram (-0.70). These readings illustrate persistent bearish momentum without meaningful relief.
Bollinger Bands reinforce this weakness, with the mid-band at $29.10 far above current price, highlighting NVTS’s drift below its recent equilibrium. The hourly pivot at $25.14 aligns close to the current price, serving as a near-term pivot line. A break below its support at $24.82 could trigger further downside toward the $23–$24 zone.
Intraday View: Signs of Potential Stabilization on 15-Minute Chart
Short-term 15-minute data shows a bearish regime but hints at tentative stabilization. The MACD histogram turned positive (+0.13) despite the MACD line remaining negative, indicating possible slowing of selling pressure—an early sign, not a full reversal.
The 15-minute RSI at 37.82 confirms deeply sold conditions without recovery. The Bollinger midline at $25.49 represents an immediate overhead resistance level for intraday rebounds. Relatively low short-term volatility, indicated by the 15-minute ATR of $0.55, means movements lack strong conviction.
Inter-Timeframe Conflict: Daily Bullishness Versus Intraday Weakness
The market shows a clear tension amid different timeframes. The daily chart sustains a bullish trend with supportive EMAs and a stable RSI. Yet, the hourly trend reveals breakdown and bearish momentum. The 15-minute data hints at early exhaustion but lacks reversal confirmation.
This conflict could resolve in two ways: either the daily bullishness asserts itself with a recovery above short-term EMAs, or hourly bearishness accelerates, degrading the daily trend. At this stage, both scenarios remain equally plausible.
Bullish Outlook: Nvidia Partnership as a Growth Catalyst
The fundamental bullish case remains credible. Navitas’ GaN semiconductor technology fits Nvidia’s AI data center expansion strategy, validated by their Computex partnership. If this collaboration translates into substantial revenue growth, Navitas stock could sustain its rally.
Technically, bulls need NVTS to hold above the daily 20-EMA at $24.72 and reclaim the pivot at $26.29. Surpassing resistance at $28.19 would reinforce the view that recent declines are healthy consolidation rather than trend reversal. The stock’s 84.9% gain since last earnings highlights notable institutional interest.
Bearish Outlook: Elevated Valuation and Profit-Taking Risks
On the other hand, the aggressive price run pricing in extensive optimism raises valid concerns. The stock’s 330%-plus year-to-date gain and 400% rally from prior lows amplify valuation risk. Critics argue that speculative momentum, not fundamental execution, drives much of the price advance.
Bearish momentum would intensify if NVTS closes below the June 5 intraday low of $24.38. This failure would signify a breakout breakdown, likely prompting further selling. Support at the daily pivot S1 of $23.17 is next, with the 50-day EMA at $19.58 representing a longer-term mean reversion target in a negative sentiment scenario.
Conclusion: Navigating Navitas Stock in a Volatile Landscape
NVTS stands at a critical inflection point. The daily trend is still bullish, but hourly momentum has cracked. Key drivers—including Nvidia collaboration, AI power demand, and GaN technology adoption—remain intact. However, the stock faces valuation pressures that could challenge execution expectations.
With significant daily price swings reflected in a high ATR, NVTS can move sharply in either direction. Current holders should monitor the $24.38 risk level closely, while prospective buyers might prefer to wait for a clean reclaim of $26.29 to improve the risk-reward balance. Given the pronounced volatility, prudent position sizing is essential.