

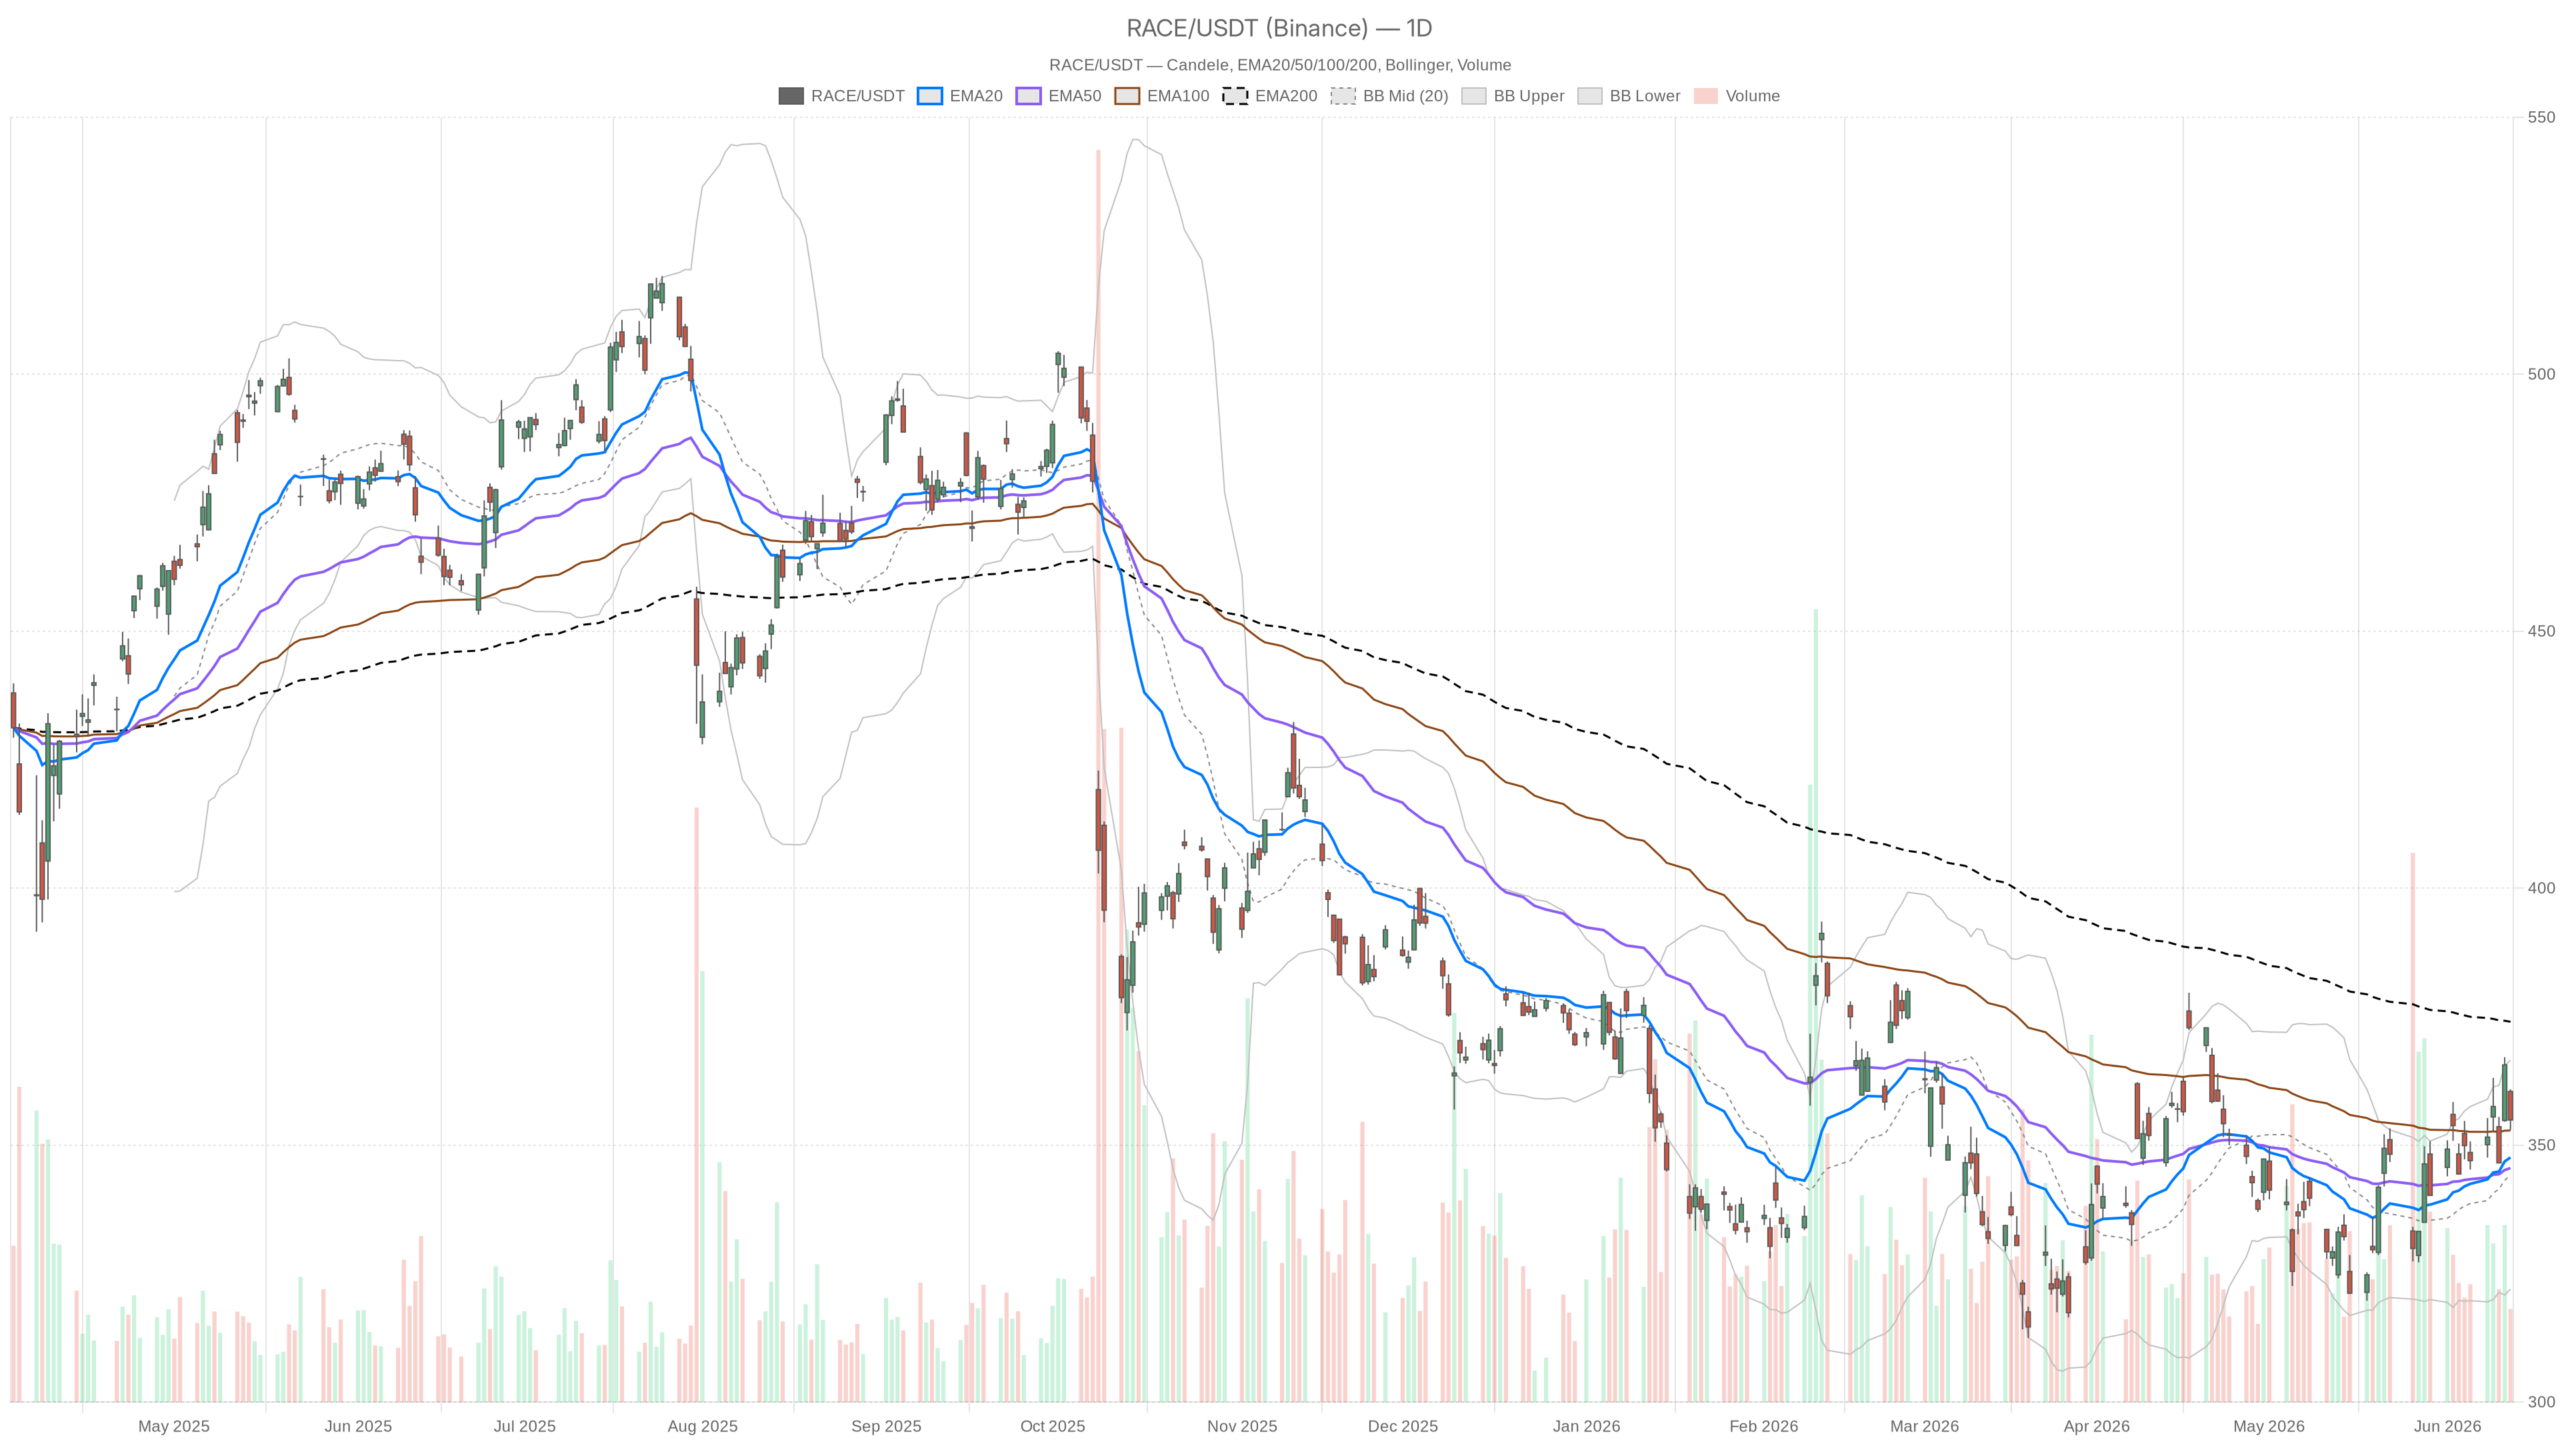
Ferrari shares are in a delicate technical phase. The RACE stock is trading around 354–355 dollars, above the short-term moving averages but still below the daily EMA200. The market is in active consolidation, where every bullish attempt clashes with a structure that demands confirmation before granting room.
Summary
Key points
- RACE is trading at 354.91 dollars, below the daily EMA200 at 374.01, which remains the long-term dynamic resistance
- The EMA20 at 347.61 and EMA50 at 345.55 dollars support the price on the daily chart, confirming a positive short-term setup
- The daily MACD is constructive, but on the hourly chart momentum is weakening
- The daily pivot point at 356.26 dollars is the level that separates the bullish scenario from uncertainty
- A break of support S1 at 351.64 dollars would expose the stock to the EMA20–EMA50 cluster at 344–346 dollars
The daily trend is constructive but held back by the EMA200
The daily picture of Ferrari shares shows a positive short-term setup, but it remains unfinished in the medium term. The price closed the June 12 session at 354.91 dollars, after opening at 360.45. A candle with a high open and a lower close tells of selling pressure during the session. Not a crash, but a signal that the market is struggling to absorb higher levels.
The EMA20 and EMA50, at 347.61 and 345.55 dollars respectively, are both below the current price. The RACE stock is therefore trading in a positive area relative to the short- and medium-term averages. The problem remains the daily EMA200 at 374.01 dollars. The price is about 19 points away from this average. Historically, the EMA200 separates structurally bullish markets from those still in a recovery phase.
Daily RSI and MACD confirm constructive momentum
The daily RSI at 54.28 places RACE in neutral-positive territory. We are far from the oversold zone and still distant from overbought. This leaves technical room to the upside without the stock already being in an excessively hot condition.
The daily MACD tells the same story with greater optimism. The MACD line at 4.26 is above the signal at 2.47, with a positive histogram at 1.78. This configuration signals bullish momentum under construction. It is not an explosion of strength, but a buying pressure that is consolidating over time.
The daily Bollinger Bands place the price above the middle band at 344.27 dollars. The stock is approaching the upper band at 366.54 dollars. There is still room to the upside, but it shrinks as the price rises. The daily ATR at 11.65 dollars confirms significant average volatility: each move can be wide and fast.
The pivot point at 356.26 dollars decides the direction
The daily pivot point at 356.26 dollars separates a bullish structure from a phase of indecision for RACE. Resistance R1 is at 359.53 and support S1 at 351.64. The current price of Ferrari shares is just below the pivot. This position is emblematic: the market has not yet chosen whether to take bullish control or give way toward support.
The hourly chart slows: price below the EMA20
On the hourly timeframe, momentum in Ferrari shares is weakening. The RACE price at 354.97 dollars has slipped below the hourly EMA20 at 355.68. This reversal compared to the daily chart signals a loss of momentum in the very short term.
The hourly RSI at 49.64 is practically neutral, anchored to the midline. No clear directional signal. The 1-hour MACD is more specific: the line at 0.76 has already crossed below the signal at 1.28. The histogram is negative at -0.52. This is a sign of weakening hourly momentum. It is not a capitulation, but the short-term bullish attempt is losing energy.
Meanwhile, the hourly Bollinger Bands show the price compressed around the middle band at 355.25 dollars. The hourly ATR at 4.23 dollars indicates contained but not negligible swings for day trading. The hourly pivot at 354.86 with R1 at 355.50 and S1 at 354.32 defines a very tight channel. The price is moving within this zone without taking a clear direction.
15-minute timeframe: compression before the move
On the 15-minute chart, Ferrari shares show a volatility compression that anticipates a directional move. The price at 354.97 is below both the EMA20 at 355.54 and the EMA50 at 355.95. Both averages are above the price and pointing downward. Only the 15-minute EMA200 at 353.26 remains below the current price, offering a very short-term dynamic support.
The 15-minute RSI falls to 44.88, approaching the weakness zone without fully entering it. The MACD is in negative territory with the line at -0.56. However, the histogram at +0.03 suggests an attempt at stabilization. It is a minimal signal, but combined with the 15-minute EMA200 it indicates a possible floor in the 353–354 dollar area.
The 15-minute Bollinger Bands are very compressed. The upper band is at 355.98 and the lower at 354.49. The price is moving in a corridor of less than 1.50 dollars. This compression often anticipates a clearer directional move. The 15-minute pivot at 354.88 almost perfectly coincides with the Bollinger structure.
Bullish scenario: RACE must regain the pivot
For a credible recovery, Ferrari shares must close steadily above the daily pivot point at 356.26 dollars. Without this step, every rebound risks remaining a technical breather without continuity. The market needs confirmation at this level before it can commit.
The second requirement is the recovery of the hourly MACD. The line must move back above the signal, restoring momentum on the intermediate timeframe in sync with the daily chart. An hourly RSI above 55 would further strengthen the picture.
Once the pivot is cleared, the first target is resistance R1 at 359.53 dollars. This area coincides with the opening zone of the previous session. Beyond that level, the technical path leads toward the upper daily Bollinger Band at 366.54. The daily EMA200 at 374.01 remains the medium-term structural target.
Bearish scenario: S1 at 351.64 is the level that must hold
The negative scenario for Ferrari shares is triggered by a decisive break of the daily S1 support at 351.64 dollars. In that case, the short-term structure deteriorates rapidly. The stock would open the way toward the middle Bollinger Band at 344.27 dollars. This area coincides with the EMA20–EMA50 cluster, between 344 and 346 dollars.
A failure of that area would invalidate the entire bullish configuration built in recent weeks. The daily RSI would likely fall below 45, signaling a loss of control by buyers. The neutral daily regime would shift toward a bearish setup. In this scenario, the downside target would move toward the 322 dollar area, the lower daily Bollinger Band.
Decision zone between 354 and 356 dollars
Ferrari shares are in an unstable balance. The daily chart is constructive, with short-term averages below the price and a MACD pushing higher. But the hourly timeframe signals hesitation. The price is struggling to hold the short-term averages and the MACD has turned negative.
The area between 354 and 356 dollars is the critical decision zone. Holding above the daily pivot, accompanied by a recovery in hourly momentum, could trigger a new attempt toward R1 and beyond. Conversely, a break below S1 would expose RACE to a more structural correction.
The compression seen on the 15-minute chart suggests that a directional choice is imminent. The market cannot remain indefinitely in this narrow corridor. The direction of the next few hours will likely define the behavior of Ferrari shares in the following days.
FAQ
What is the most important technical level to monitor for Ferrari shares?
The daily pivot point at 356.26 dollars represents the dividing line between a bullish scenario and a phase of uncertainty. As long as RACE remains below this level, the technical structure stays on edge and every rebound risks being temporary.
What does RACE’s hourly MACD signal?
The hourly MACD has crossed below the signal, with a negative histogram at -0.52. This signals a weakening of short-term momentum, in contrast with the daily picture which remains constructive.
What is needed to trigger a bullish scenario on Ferrari?
The stock must close above the pivot at 356.26 dollars and the hourly MACD must turn positive again. The first target would be resistance R1 at 359.53, then the upper Bollinger Band at 366.54 dollars.
What is the key support to defend to avoid a bearish reversal?
Support S1 at 351.64 dollars is the critical level. A break would expose RACE to the EMA20–EMA50 cluster at 344–346 dollars. Below that area, the target would become 322 dollars, the lower daily Bollinger Band.
{“@context”:”https://schema.org”,”@type”:”FAQPage”,”mainEntity”:[{“@type”:”Question”,”name”:”What is the most important technical level to monitor for Ferrari shares?”,”acceptedAnswer”:{“@type”:”Answer”,”text”:”The daily pivot point at 356.26 dollars represents the dividing line between a bullish scenario and a phase of uncertainty. As long as RACE remains below this level, the technical structure stays on edge and every rebound risks being temporary.”}},{“@type”:”Question”,”name”:”What does RACE’s hourly MACD signal?”,”acceptedAnswer”:{“@type”:”Answer”,”text”:”The hourly MACD has crossed below the signal, with a negative histogram at -0.52. This signals a weakening of short-term momentum, in contrast with the daily picture which remains constructive.”}},{“@type”:”Question”,”name”:”What is needed to trigger a bullish scenario on Ferrari?”,”acceptedAnswer”:{“@type”:”Answer”,”text”:”The stock must close above the pivot at 356.26 dollars and the hourly MACD must turn positive again. The first target would be resistance R1 at 359.53, then the upper Bollinger Band at 366.54 dollars.”}},{“@type”:”Question”,”name”:”What is the key support to defend to avoid a bearish reversal?”,”acceptedAnswer”:{“@type”:”Answer”,”text”:”Support S1 at 351.64 dollars is the critical level. A break would expose RACE to the EMA20–EMA50 cluster at 344–346 dollars. Below that area, the target would become 322 dollars, the lower daily Bollinger Band.”}}]}
Disclaimer: This article is for informational purposes only and does not constitute financial advice, investment recommendation or a solicitation to buy or sell financial instruments or cryptocurrencies. The analyses do not guarantee future results. Investments in crypto-assets and financial markets involve a high risk of capital loss. Always do your own research (DYOR) and consult a qualified financial advisor before making any decision.
Content created with the assistance of artificial intelligence and human editorial review.