

AMD shares are trading at $511, driven by the AI deal with Meta Platforms and by Citi’s upgrade with a target at $575. The technical structure confirms a bullish regime on all timeframes. But the picture is not without tension. Understanding exactly where the market is makes the difference between a timely trade and a rushed one.
Summary
Key points
- AMD is trading at $511 with Citi’s target raised to $575, supported by the AI deal with Meta
- Daily EMAs aligned in bullish order: EMA20 at 474, EMA50 at 405, EMA200 at 273 dollars
- Daily MACD: positive line but negative histogram at -8.16 — deceleration to monitor
- Key resistance at 524 (daily R1), immediate support at 496 (daily S1), pivot point at 509
- The deal with Meta is the largest ever signed by AMD in the AI segment
Market thesis
Advanced Micro Devices is experiencing a re-acceleration phase of the bullish trend. The multi-year deal with Meta for Instinct GPUs is the largest ever signed by the company in the AI segment. Citi’s upgrade indicates that the market may not yet have fully priced in this transformation. AMD is moving from CPU manufacturer to structural player in artificial intelligence. The technical regime is bullish, but the daily momentum shows signs of deceleration that deserve attention.
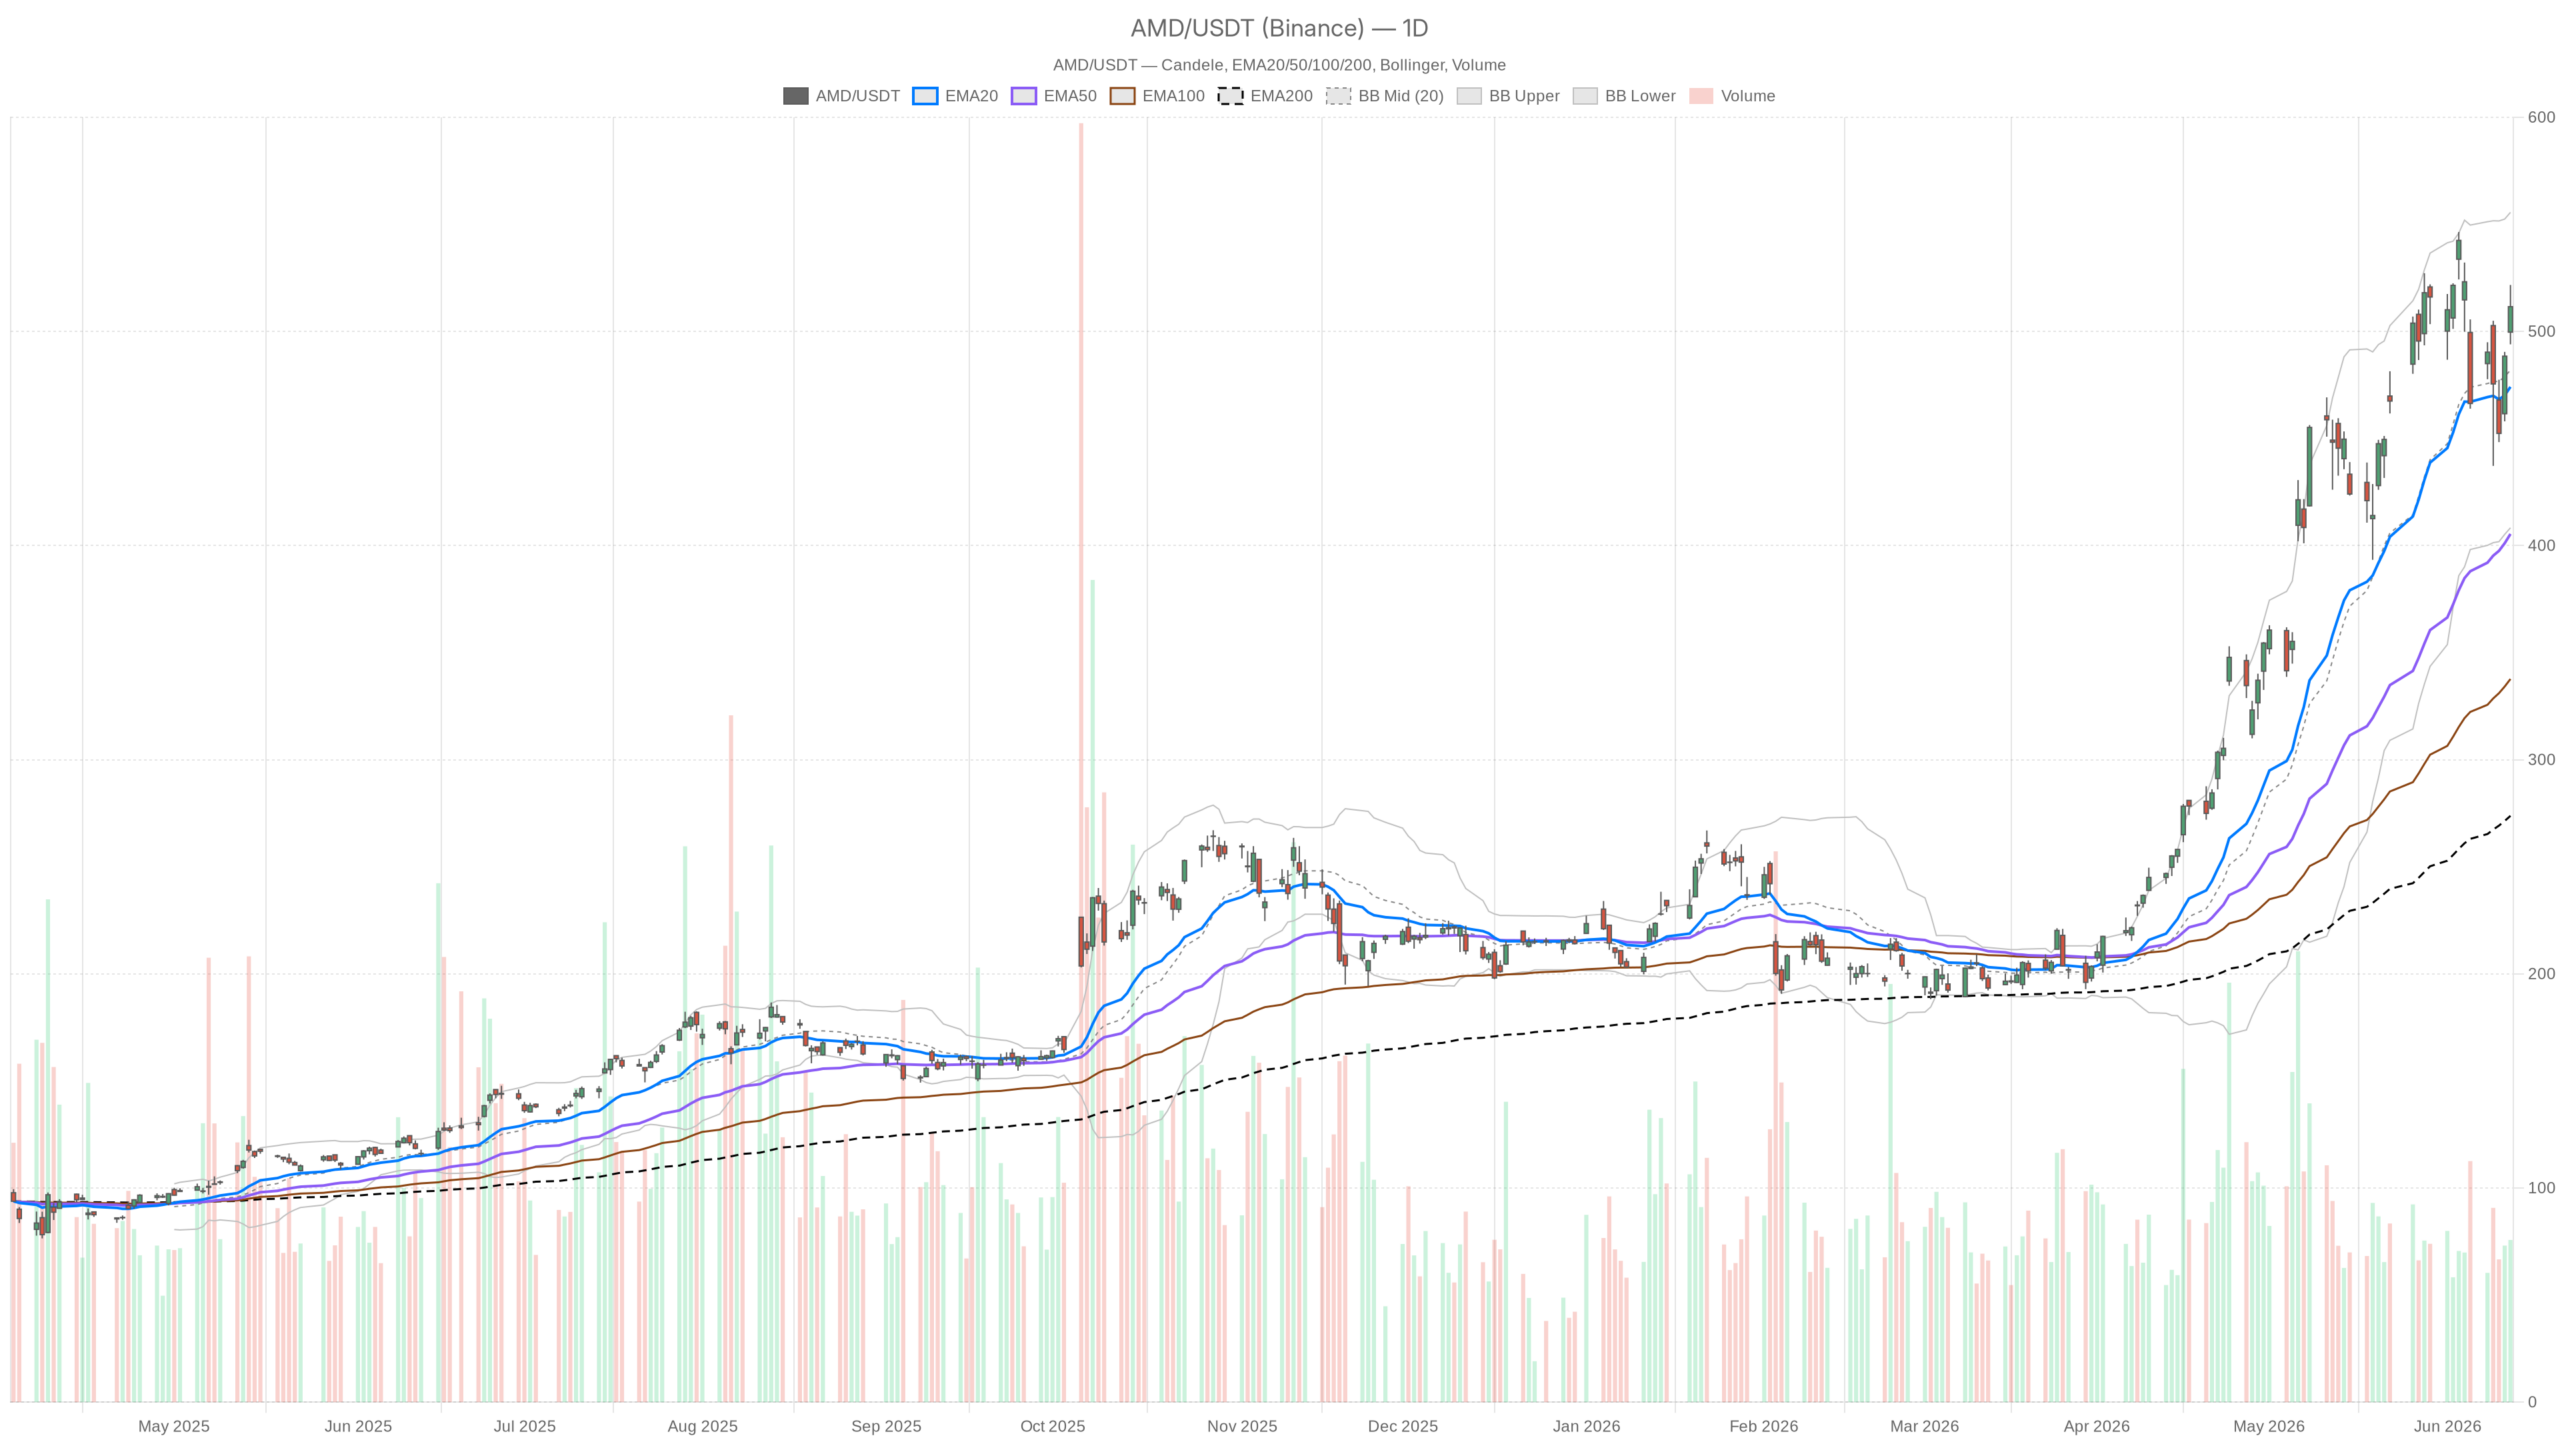
Daily trend: bullish structure with MACD signal to monitor
On the daily chart, the price is clearly above all the exponential moving averages. The EMA20 at 474, EMA50 at 405 and EMA200 at 273 dollars form a vertical alignment. This confirms a primary bullish trend, with no threats from long-term averages.
The RSI at 60.45 is not overbought, but the stock remains in a zone of strength with technical room to extend. The real element to monitor is the daily MACD: the line at 28.51 is positive, but the histogram is negative at -8.16. The bullish push is weakening compared to the signal average. This is not a reversal, it is a deceleration.
The Bollinger Bands show the upper band at 555 and the lower at 408 dollars. The price is moving in the upper half of the channel: a position of strength, but with volatility already expanded. The ATR at 35 dollars confirms wide daily swings, a relevant element for risk management.
Daily pivots: where the market is balancing
The pivot levels place the equilibrium at $509. R1 is at 524, S1 at 496. With Friday’s close at 511.57, the stock is slightly above the pivot point: marginal bullish advantage, not a clear breakout. Above 524, there is room towards the 550 area. Below 496, the risk is a return towards the EMA20 at 474.
Hourly analysis: rising momentum, first test approaching
On the hourly timeframe, the picture remains constructive. The EMAs are aligned in a bullish direction: EMA20 at 493, EMA50 at 489, EMA200 at 453. The price at 511 is well above all three. The intraday trend is intact.
The hourly MACD is positive with a histogram at +4.96: active momentum that supports the bullish reading. The RSI at 63 is strong, but approaching 70, a threshold beyond which the pace has historically tended to slow. The hourly pivots place R1 at 514.58. With the price having already touched 515, that resistance is the first concrete test. A close above 515 would open the 520–525 range.
15-minute timeframe: micro-consolidation underway
The 15-minute timeframe shows a more uncertain dynamic. The MACD is in negative territory with a histogram at -2. The last bullish impulse is running out in the very short term. The RSI at 55 is neutral, without directionality. The price coincides with the EMA20 at 511 dollars.
The Bollinger Bands have the upper band at 520.57 and the lower at 507.38. The price is compressed towards the center of the channel: micro-consolidation after the rally. The 510–511 area is the immediate support. Below 510, the move would head towards the pivot at 508.95. Above 514, a new attempt towards 520 is triggered.
Bullish scenario: steps to confirm the target
To move closer to the $575 target indicated by Citi, several confirmations are needed. The first step is holding the 496–500 area as dynamic support on the daily chart. If the stock maintains this zone even in the event of a correction, the bullish structure remains intact.
The second element is a clear break of 524, the daily R1 level. A convincing close above that threshold would change the tone of the market. It would open the way towards 550 and then towards the analyst’s target. The daily MACD must return with a positive histogram: this would be the signal that momentum has regained strength after the current pause.
The RSI can rise towards 70 without creating problems, as long as the price finds support on pullbacks. Narrative sentiment remains favorable. The Meta deal and Citi’s upgrade fuel institutional demand, creating conditions for an extension of the rally.
Bearish scenario: levels that would change the picture
The critical level remains the 496–500 area. The loss of the daily S1 at 496 would be the first warning sign. The next reference is the EMA20 at 474, a level that has historically acted as a floor in recent pullbacks.
A deterioration below 474 would call the short-term structure into question. Attention would shift towards 450, the area of the weekly EMA50. If the daily MACD were to deepen into negative territory, the current deceleration would turn into distribution. Also to be monitored are the 160 million warrants issued for Meta: they could fuel short-term technical selling pressure.
Context: where uncertainty lies
AMD shares are navigating a delicate but promising phase. The underlying trend is unequivocally bullish. Moving averages, price position and technical regime all tell the same story. However, the daily MACD with a negative histogram and the slightly weak 15-minute chart indicate that the market is digesting Friday’s rally.
Uncertainty is concentrated between 510 and 524 dollars. Traders are assessing whether the stock will consolidate above the pivot at 509 or fall back towards support at 496. In the medium term, the AI theme continues to provide the backdrop: the deal with Meta positions AMD as a structural alternative to Nvidia in data centers. This is the narrative that pushes institutional investors to increase their exposure.
Citi’s forecasts with a $575 target rest on solid fundamental bases. But the market will decide if and when to price them in. Technicals will be the first signal to interpret.
FAQ
What is the current target price for AMD shares?
Citi has raised the target price to $575, supported by the AI deal with Meta Platforms, the largest ever signed by AMD in the segment.
What are the key levels to monitor in the short term?
The immediate resistance is at $524 (daily R1), support at $496 (daily S1), with the pivot point at $509. Above 524 there is room towards 550; below 496 the stock risks a return towards the EMA20 at 474.
Does the daily MACD signal a bearish reversal?
No. The MACD line remains positive at 28.51. The negative histogram at -8.16 indicates a deceleration in momentum, not a trend reversal. The underlying bullish structure remains intact.
Why is the deal with Meta relevant for AMD?
It is the largest AI deal ever signed by AMD for the supply of Instinct GPUs. It positions the company as a credible alternative to Nvidia in the data center segment, accelerating the transformation from CPU manufacturer to structural player in artificial intelligence.
{“@context”:”https://schema.org”,”@type”:”FAQPage”,”mainEntity”:[{“@type”:”Question”,”name”:”What is the current target price for AMD shares?”,”acceptedAnswer”:{“@type”:”Answer”,”text”:”Citi has raised the target price to $575, supported by the AI deal with Meta Platforms, the largest ever signed by AMD in the segment.”}},{“@type”:”Question”,”name”:”What are the key levels to monitor in the short term?”,”acceptedAnswer”:{“@type”:”Answer”,”text”:”The immediate resistance is at $524 (daily R1), support at $496 (daily S1), with the pivot point at $509. Above 524 there is room towards 550; below 496 the stock risks a return towards the EMA20 at 474.”}},{“@type”:”Question”,”name”:”Does the daily MACD signal a bearish reversal?”,”acceptedAnswer”:{“@type”:”Answer”,”text”:”No. The MACD line remains positive at 28.51. The negative histogram at -8.16 indicates a deceleration in momentum, not a trend reversal. The underlying bullish structure remains intact.”}},{“@type”:”Question”,”name”:”Why is the deal with Meta relevant for AMD?”,”acceptedAnswer”:{“@type”:”Answer”,”text”:”It is the largest AI deal ever signed by AMD for the supply of Instinct GPUs. It positions the company as a credible alternative to Nvidia in the data center segment, accelerating the transformation from CPU manufacturer to structural player in artificial intelligence.”}}]}
Disclaimer: This article is for informational purposes only and does not constitute financial advice, investment recommendation or a solicitation to buy or sell financial instruments or cryptocurrencies. The analyses do not guarantee future results. Investments in crypto-assets and financial markets involve a high risk of capital loss. Always do your own research (DYOR) and consult a qualified financial advisor before making any decision.
Content created with the assistance of artificial intelligence and human editorial review.