



Marvell Technology has been one of the defining momentum stories of 2026. After surging 228% year-to-date on AI infrastructure spending and a high-profile endorsement from Nvidia’s CEO, Marvell stock now faces a critical juncture. The daily chart remains bullish, but shorter timeframes flash near-term exhaustion.
Summary
Key takeaways
- Marvell stock has surged 228% year-to-date, closing at $289.54 on June 17, but the daily MACD has flattened near zero.
- The daily EMA stack (20/50/200) remains cleanly bullish, with price trading well above all three moving averages.
- Hourly and 15-minute timeframes show bearish alignment, with RSI declining and MACD histograms negative across both.
- A break below $279 would invalidate the short-term bullish thesis; reclaiming $293–$296 restores upside momentum.
- Daily ATR of 36.8 signals high volatility — directional shifts can unfold within a single session.
Daily Bias: Structurally Bullish, But Momentum Is Thinning
The daily trend on Marvell stock remains structurally intact, with price well above all key moving averages. However, momentum indicators are showing early signs of fatigue.
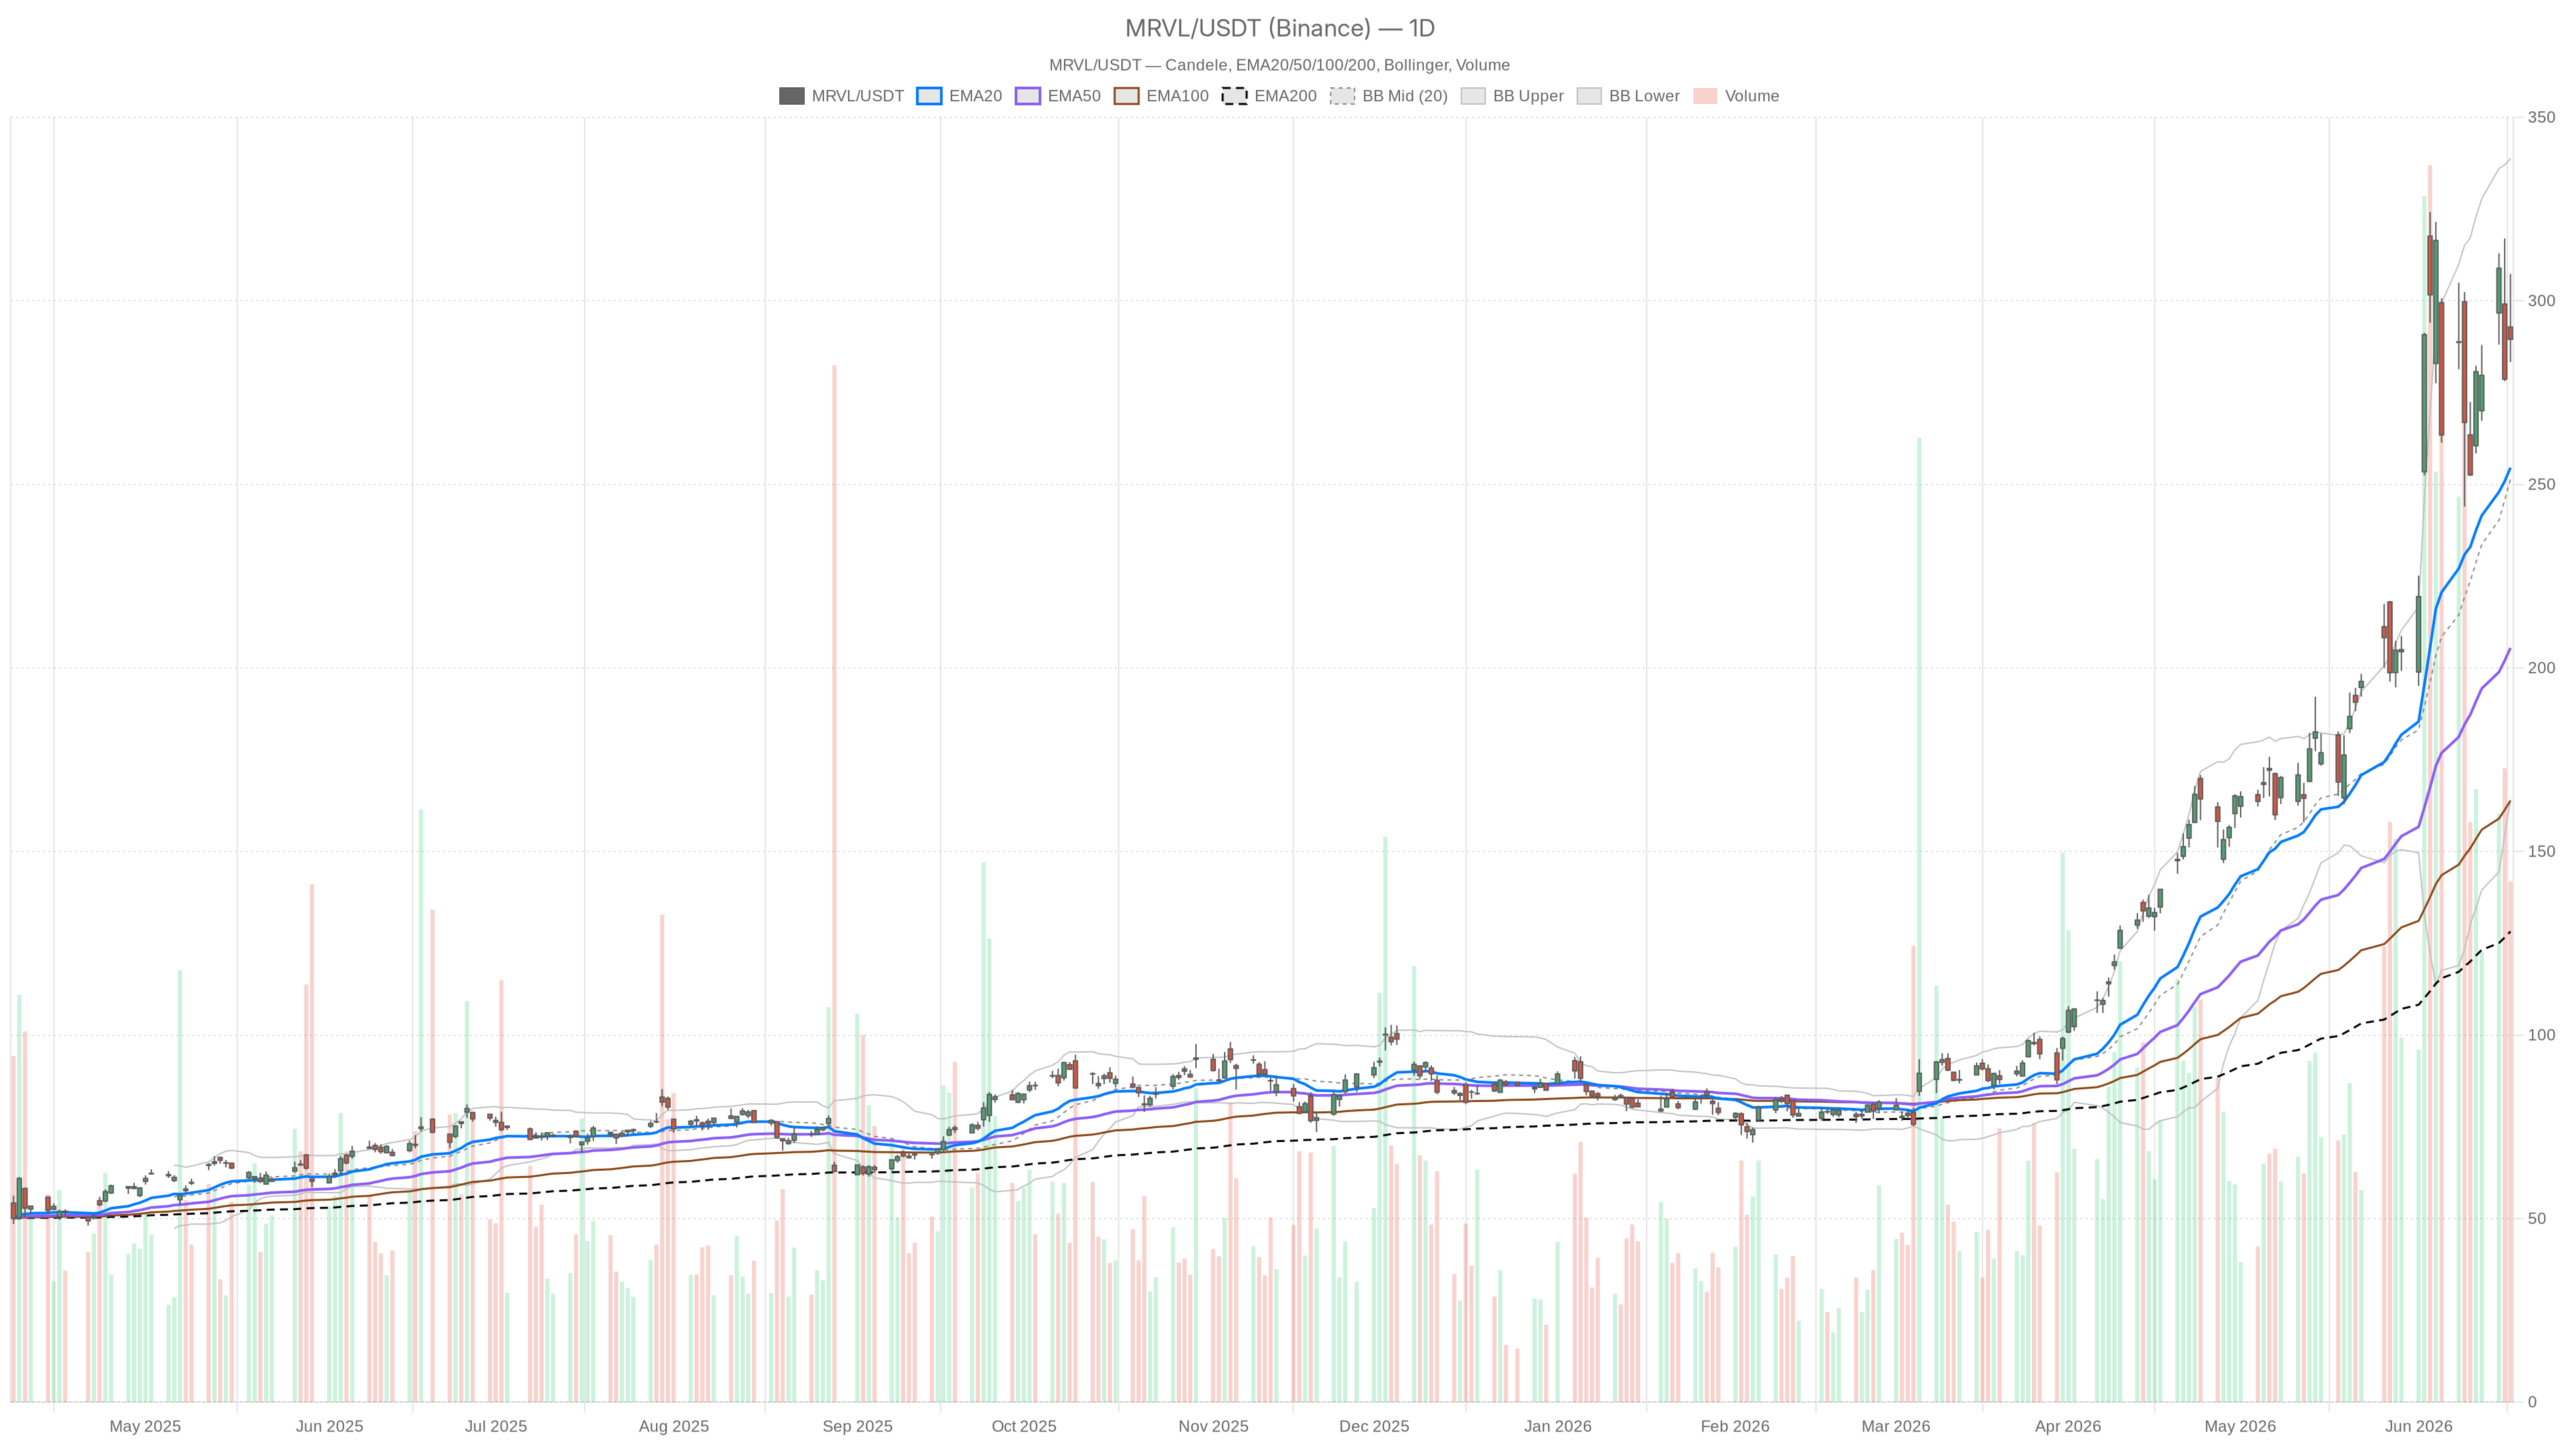
The daily timeframe leaves little doubt about the primary trend. MRVL closed at $289.54 on June 17, well above all three major exponential moving averages. The EMA20 sits at $254.56, EMA50 at $205.46, and EMA200 at $128.21. That stack is clean and upward-sloping. However, price is trading roughly 35 points above the EMA20 — a position that signals sustained demand but also stretched conditions.
The daily RSI sits at 61.16. That is constructive territory, technically still below overbought levels. Yet the number alone does not tell the full story. The MACD histogram is essentially flat at -0.02. Meanwhile, the MACD line at 30.07 has barely crossed below its signal line at 30.09. It marks the first visible loss of upward momentum in recent sessions, though with almost no bearish conviction.
Bollinger Bands and Volatility Context
The Bollinger Bands on the daily chart tell a similar story. With the midline at $251.41 and the upper band at $338.74, MRVL has room to extend higher without technically breaching overbought territory. Still, the current close near $289 is already pulling back from a session high of $307.37. That wide daily range of over $24 reflects real indecision at these levels.
Daily ATR of 36.8 underscores the volatility environment. Marvell does not move in quiet, orderly increments right now. Participants should treat every directional signal with that volatility buffer in mind. The daily pivot is at $293.41, with resistance at $303.50 and support at $279.45.
Hourly Picture: The Bullish Case Weakens
The hourly chart weakens the bullish case, with Marvell stock now trading below key intraday moving averages and momentum turning negative.
Notably, price closed the last hourly candle at $289.64, below the 1H EMA20 at $292.91 and the Bollinger midline at $296.86. That alone signals a short-term shift in control. The hourly regime is classified as neutral, not bullish.
The 1H RSI has dropped to 48.45, barely above the 50 centerline. This marks a notable deterioration from earlier in the session, when MRVL hit its intraday high of $300.25. The hourly MACD confirms the pullback. The MACD line at 2.52 sits below the signal at 3.49, with a histogram of -0.97 that is clearly negative and deepening.
In contrast, the EMA structure on the 1H remains supportive in a broader sense. Price is still above the 1H EMA50 at $285.60 and comfortably above the 1H EMA200 at $240.22. So while near-term momentum has turned, the hourly chart has not broken down structurally. The 1H pivot support at $285.82 becomes the key level to watch. A close below it would suggest the intraday correction is extending into something more meaningful.
15-Minute Execution Context: Sellers in Control
The 15-minute chart is uniformly bearish. Marvell stock sits below its key moving averages, with selling pressure persistent through the final trading window.
Price at $289.64 sits below the 15m EMA20 at $296.14 and below the EMA50 at $295.00. It remains only marginally above the EMA200 at $288.24. The RSI on this timeframe is at 42.85, sliding toward oversold territory. The MACD histogram is negative at -0.47, confirming continued selling pressure.
Notably, the 15m lower Bollinger Band is at $288.42, very close to the current close. That band proximity, combined with RSI near 43, suggests the short-term selling impulse could be approaching a local exhaustion point. However, this is purely execution-level context. It does not override the directional signals on higher timeframes.
The Bullish Scenario: AI Tailwinds and Structure Intact
The bullish case for Marvell stock rests on exceptional AI-driven fundamentals and a daily technical structure that remains unbroken.
The fundamental backdrop for MRVL remains exceptionally strong. Nvidia’s $2 billion investment and expanded optical interconnect partnership signal institutional confidence at the highest level. Hyperscalers actively expanding custom chip programs represent a multi-year revenue tailwind already showing up in bookings. Jensen Huang’s public identification of Marvell as a potential trillion-dollar company is not a comment that gets reversed quietly.
Technically, the bullish scenario requires a reclaim of the $293–$296 zone. This means recapturing the daily pivot at $293.41 and the 1H Bollinger midline near $296.86. If price regains these levels on volume, the daily structure holds and the MACD flat cross resolves to the upside. In that case, a retest of the $303.50 daily R1 becomes the natural next target. The $307 session high serves as the broader upside reference.
The Bearish Scenario: Valuation Risk and Momentum Fade
The bearish case for Marvell stock is grounded in two converging risks: stretched valuation assumptions and a tangible loss of daily momentum.
First, valuation. Multiple independent analyses suggest MRVL’s current price already embeds aggressive long-term growth assumptions. The outgoing CFO filing to sell $65 million worth of shares adds a layer of insider pressure. The market cannot ignore this, regardless of the routine nature of such transactions.
Second, momentum. A daily MACD that has gone flat after a near-vertical rally is not a trivial signal. If the histogram drifts negative and the RSI rolls below 55, the daily bias could shift from bullish to neutral before month-end. In that scenario, the next meaningful support is $279.45 (daily S1), followed by the EMA20 at $254.56. That represents a roughly 12% pullback from current levels. The broader uptrend would still remain entirely intact.
Invalidation Zone
Therefore, invalidation of the bullish short-term thesis comes on a confirmed break below $279, on above-average volume, with the daily RSI declining through the 50 level.
Positioning, Volatility, and the Core Tension
Marvell stock sits at a fascinating crossroads, with the daily structure bullish but near-term momentum clearly cooling across shorter timeframes.
Overall, the daily regime is bullish and the structural EMA stack is unambiguous. Yet near-term momentum is clearly cooling. The hourly and 15-minute timeframes are aligned in bearish direction. The daily ATR near $37 means the difference between a confirmed pullback and a new leg higher is measured in a single aggressive session.
For those already in positions, the $279–$280 zone represents a reasonable stop-loss anchor. New entries chasing the existing trend carry real risk at these prices, given the flat MACD and the intraday rejection from $307. Patience for a stabilization candle on the daily would sharpen the risk/reward considerably. Ideally, the close should recapture the $293 pivot. The AI story behind MRVL is not going away. But after a 228% run, even the best stories take a breath before the next chapter.
FAQ
Is Marvell stock still a buy after the 228% rally?
The daily trend remains structurally bullish, with price well above all key EMAs. However, short-term momentum is cooling and the MACD has flattened. Waiting for a stabilization candle above the $293 pivot would improve the risk/reward for new entries.
What are the key support levels for MRVL?
The nearest support is $285.82 (1H pivot), followed by $279.45 (daily S1). A confirmed break below $279 on above-average volume would invalidate the short-term bullish thesis. The next major support sits at the daily EMA20 near $254.56.
What is driving Marvell stock’s long-term bullish case?
The bullish thesis is anchored in AI infrastructure spending, Nvidia’s $2 billion investment and optical interconnect partnership, hyperscaler custom chip programs, and a high-profile endorsement from Jensen Huang identifying Marvell as a potential trillion-dollar company.
How volatile is Marvell stock right now?
Daily ATR stands at 36.8, meaning MRVL can move roughly $37 in a single session. This high volatility means directional shifts can materialize quickly, and position sizing should account for this expanded range.
Disclaimer: This article is for informational purposes only and does not constitute financial advice, an investment recommendation, or a solicitation to buy or sell any financial instrument or cryptocurrency. The analysis provided is not indicative of future results. Investing in crypto assets and financial markets carries a high risk of capital loss. Always do your own research (DYOR) and consult a qualified financial advisor before making any decision.
Article produced with the assistance of artificial intelligence and reviewed by the editorial team.
