

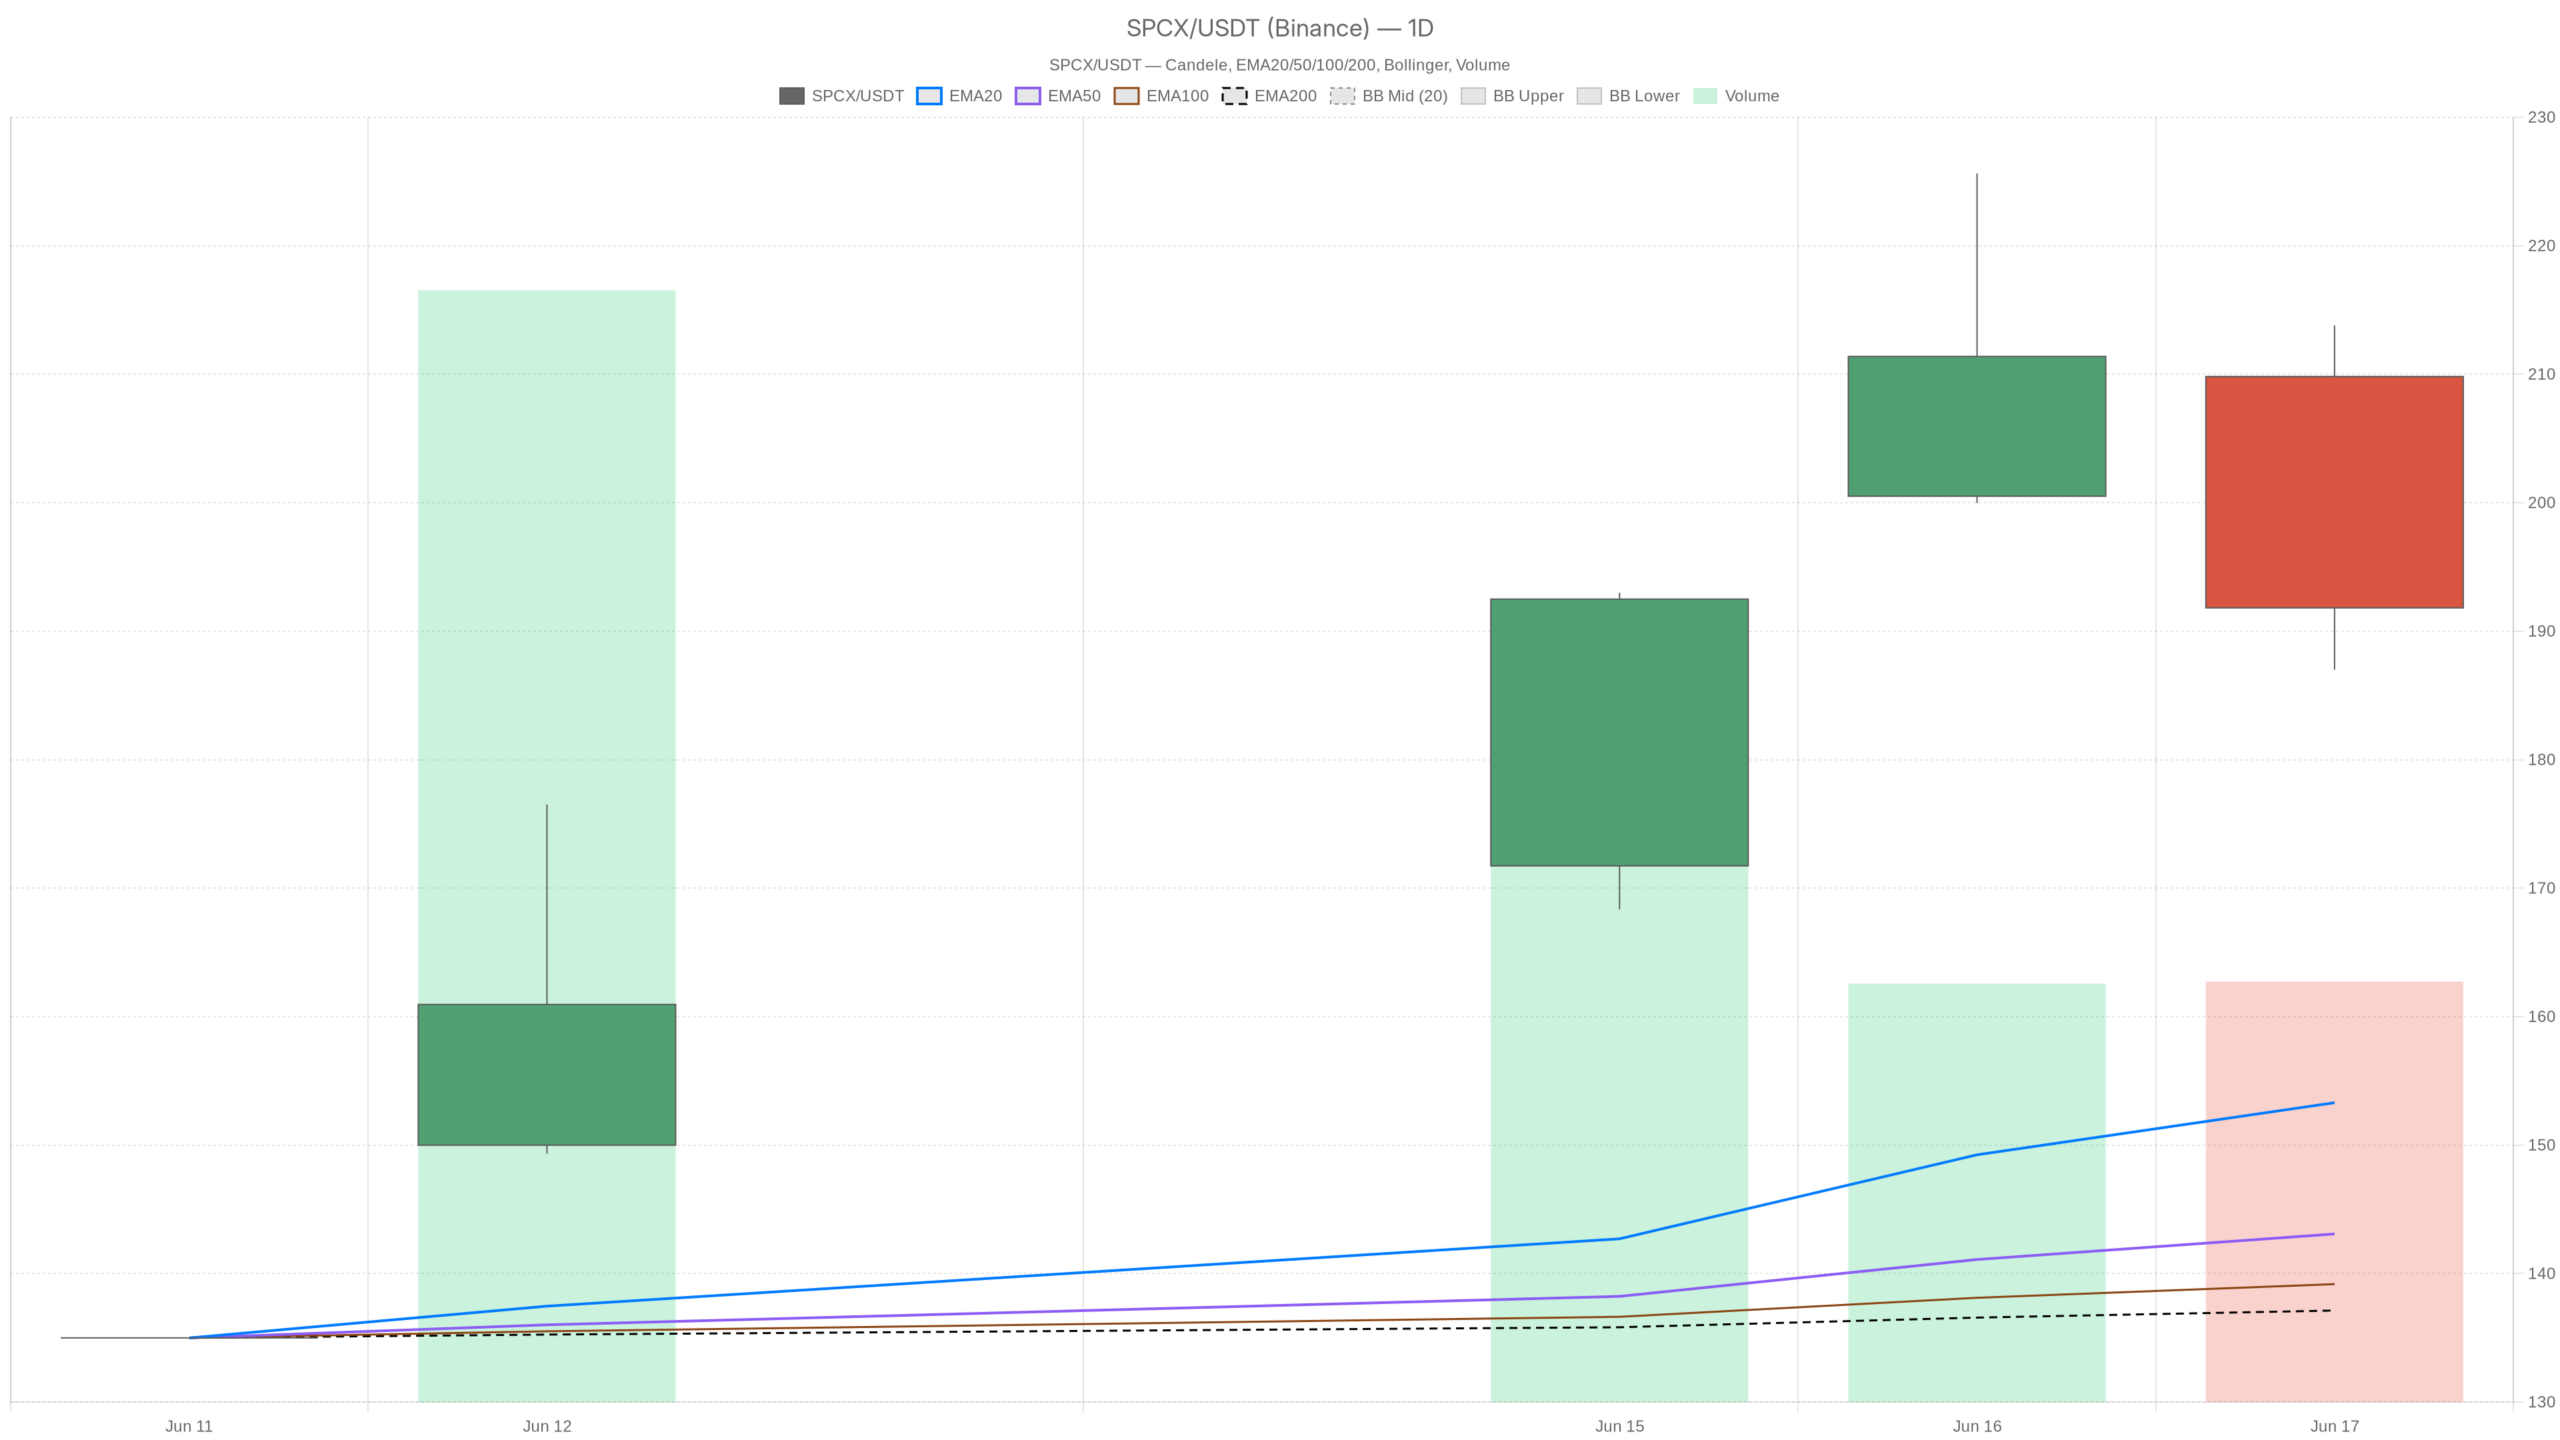
SpaceX shares recorded the first day of downside pressure since SPCX landed on the Nasdaq. On 17 June the stock closed at $191.82, sharply down from the intraday high of 213.80. Despite the pullback, the primary bullish trend remains confirmed by the technical structure on all the main timeframes.
Summary
Key points
- SPCX closes at $191.82, below the daily pivot point at 197.54
- The daily trend remains bullish: price above EMA20 (153.31), EMA50 (143.09) and EMA200 (137.13)
- Hourly MACD turns negative at -2.11, signaling loss of short-term momentum
- Immediate support at $190, key resistance at 197.54
- The hourly ATR at 10.42 points indicates extreme volatility still in play
The daily picture: bullish trend intact, but price is losing ground
Despite the first post-IPO correction, SPCX’s primary trend remains bullish. The three exponential moving averages show an orderly structure: EMA20 at $153.31, EMA50 at 143.09 and EMA200 at 137.13. The current price, although down, is well above all three levels. The underlying technical regime has not been affected.
On the momentum front, the daily MACD is still clear. The main line at 12.81 is above the signal at 5.30, with a positive histogram of 7.51. The thrust accumulated in the first post-IPO sessions is still present. Wednesday’s session, however, left a visible mark. The question is not whether the trend exists, but how long it can hold under the pressure of profit-taking.
The daily pivot levels define the immediate playing field. The pivot point is at 197.54, with first support at 181.29 and first resistance at $208.08. The close at 191.82 places SPCX below the PP. This is a short-term sign of weakness, which however does not put the underlying structure at risk.
Hourly momentum: the bounce is not convincing
On the hourly timeframe, momentum is clearly deteriorating. The last candle closed at $192.20, with an open at 195.50 and a low at 190.00. The price is below the hourly EMA20 at 193.54, which at this stage acts as dynamic resistance. Further down, EMA50 at 183.06 and EMA200 at 170.86 still confirm a solid medium-term framework.
The hourly RSI stands at 56.47, in a grey area that signals neither exhaustion nor strength. Momentum is there, but the push to bring the price back towards new short-term highs is missing. The hourly MACD is already negative: line at 5.51 below the signal at 7.62, with histogram at -2.11. The loss of momentum is clear.
The hourly Bollinger Bands show a very distant upper band at 220.59 and a lower band at 172.98, with the mid at 196.79. Historically, positioning below the middle band precedes a stabilization or a further decline before a recovery.
Short-term pressure: the 15-minute chart shows active sellers
The 15-minute timeframe offers a more direct and less ambiguous reading. The RSI drops to 38.50, approaching the oversold area without entering it yet. The MACD is negative across the board: line at -1.49, signal at -1.25, histogram at -0.24. Short-term bearish pressure is real and active.
An interesting technical element: the 20- and 50-period EMAs on the 15-minute chart are practically overlapping at 196.74 and 196.72. The price is about four points below both. This configuration indicates that sellers have prevailed in recent hours. A decisive recovery above 196.70 would be needed to reverse the short-term dynamics.
The 15-minute Bollinger Bands show a lower band at $190.40. The session low hit exactly 190.00, very close to this level. Holding this area represents a potential point of interest for those looking for a technical entry on SPCX.
Bullish scenario: what is needed to start rising again
To resume the upward path, SPCX must first of all regain the daily pivot point at $197.54 with a convincing close. As long as it remains below this level, short-term bearish pressure keeps control of the intraday narrative.
The next target is resistance at 208.08, coinciding with R1 of the daily pivot. A return to that area, accompanied by confirming volumes, would open the way towards the previous session’s high at 213.80. In terms of momentum, two conditions are needed: hourly MACD back in positive territory and RSI decisively above 60.
The market context is pushing in this direction. The debut of options on SPCX saw over 1.6 million contracts traded on the first day, a volume just below Tesla and Nvidia. This level of participation signals very strong institutional and retail interest. Historically, it fuels volatility but also favors rapid recoveries after corrections.
Bearish scenario: the levels that would change the picture
A decisive break below $189.37 — S1 of the hourly pivot — would be the first concrete warning signal. Below that level, the next relevant daily support is at 181.29. A daily close below this threshold would indicate a broader and more structured correction. The potential extension target would be the daily EMA20 at 153.31.
This possibility is currently secondary to the overall picture. The primary trend is bullish. However, the volatility of the stock is extreme: the 14-period ATR on the hourly chart is 10.42 points. This means that a ten-point move in a single hour is not unusual at all. Any trading activity on SPCX must incorporate this level of fluctuation into risk management.
Tension between timeframes: where the uncertainty lies
The current picture of SpaceX shares is a classic case of conflict between timeframes. The daily chart is bullish and structured, with moving averages in ascending order and a positive MACD. The hourly and 15-minute charts tell a different story: deteriorating momentum, price below short-term averages, negative MACD.
This tension is not necessarily a problem. It is the normal physiology of a stock that, after an explosive post-IPO rally, is digesting the first round of profit-taking. The real question is whether the market will find a balance between $189 and $197. Alternatively, the correction may need to go deeper before absorbing selling pressure.
There are three levels to monitor. The first is $190, immediate technical support coinciding with the lower Bollinger Band on the 15-minute chart. The second is 197.54, the daily pivot point to be reclaimed. The third is 208, the first concrete bullish target. The next session will be decisive in assessing the quality of the correction and the solidity of the structure built in SPCX’s first trading days.
FAQ
Did SPCX really reverse its trend after the 17 June drop?
No. The primary daily trend remains classified as bullish. The price is still well above the three main EMAs (20, 50, 200). The drop represents the first round of profit-taking after three consecutive up sessions, not a structural reversal.
What are the key levels to watch in the next session?
Immediate support at $190, daily pivot point at 197.54 as the dividing line between bearish pressure and recovery attempt, resistance at 208.08 as the first bullish target. Below 189.37 the first warning signal would be triggered.
How volatile is SPCX and what does it mean in practice?
The hourly ATR at 10.42 points indicates that ten-point swings in a single hour fall within the stock’s normal behavior. This requires appropriately sized risk management, with stop losses that take this amplitude of movement into account.
{“@context”:”https://schema.org”,”@type”:”FAQPage”,”mainEntity”:[{“@type”:”Question”,”name”:”Did SPCX really reverse its trend after the 17 June drop?”,”acceptedAnswer”:{“@type”:”Answer”,”text”:”No. The primary daily trend remains classified as bullish. The price is still well above the three main EMAs (20, 50, 200). The drop represents the first round of profit-taking after three consecutive up sessions, not a structural reversal.”}},{“@type”:”Question”,”name”:”What are the key levels to watch in the next session?”,”acceptedAnswer”:{“@type”:”Answer”,”text”:”Immediate support at $190, daily pivot point at 197.54 as the dividing line between bearish pressure and recovery attempt, resistance at 208.08 as the first bullish target. Below 189.37 the first warning signal would be triggered.”}},{“@type”:”Question”,”name”:”How volatile is SPCX and what does it mean in practice?”,”acceptedAnswer”:{“@type”:”Answer”,”text”:”The hourly ATR at 10.42 points indicates that ten-point swings in a single hour fall within the stock’s normal behavior. This requires appropriately sized risk management, with stop losses that take this amplitude of movement into account.”}}]}
Disclaimer: This article is for informational purposes only and does not constitute financial advice, investment recommendation or a solicitation to buy or sell financial instruments or cryptocurrencies. The analyses do not guarantee future results. Investments in crypto-assets and financial markets involve a high risk of capital loss. Always do your own research (DYOR) and consult a qualified financial advisor before making any decision.
Content created with the assistance of artificial intelligence and human editorial review.