

SpaceX Stock (SPCX) posted its first decline since its IPO on Wednesday, closing at $191.82 after a three-session surge. The daily trend remains firmly bullish. However, intraday momentum is cooling — a divergence that demands careful attention.
Summary
Key takeaways
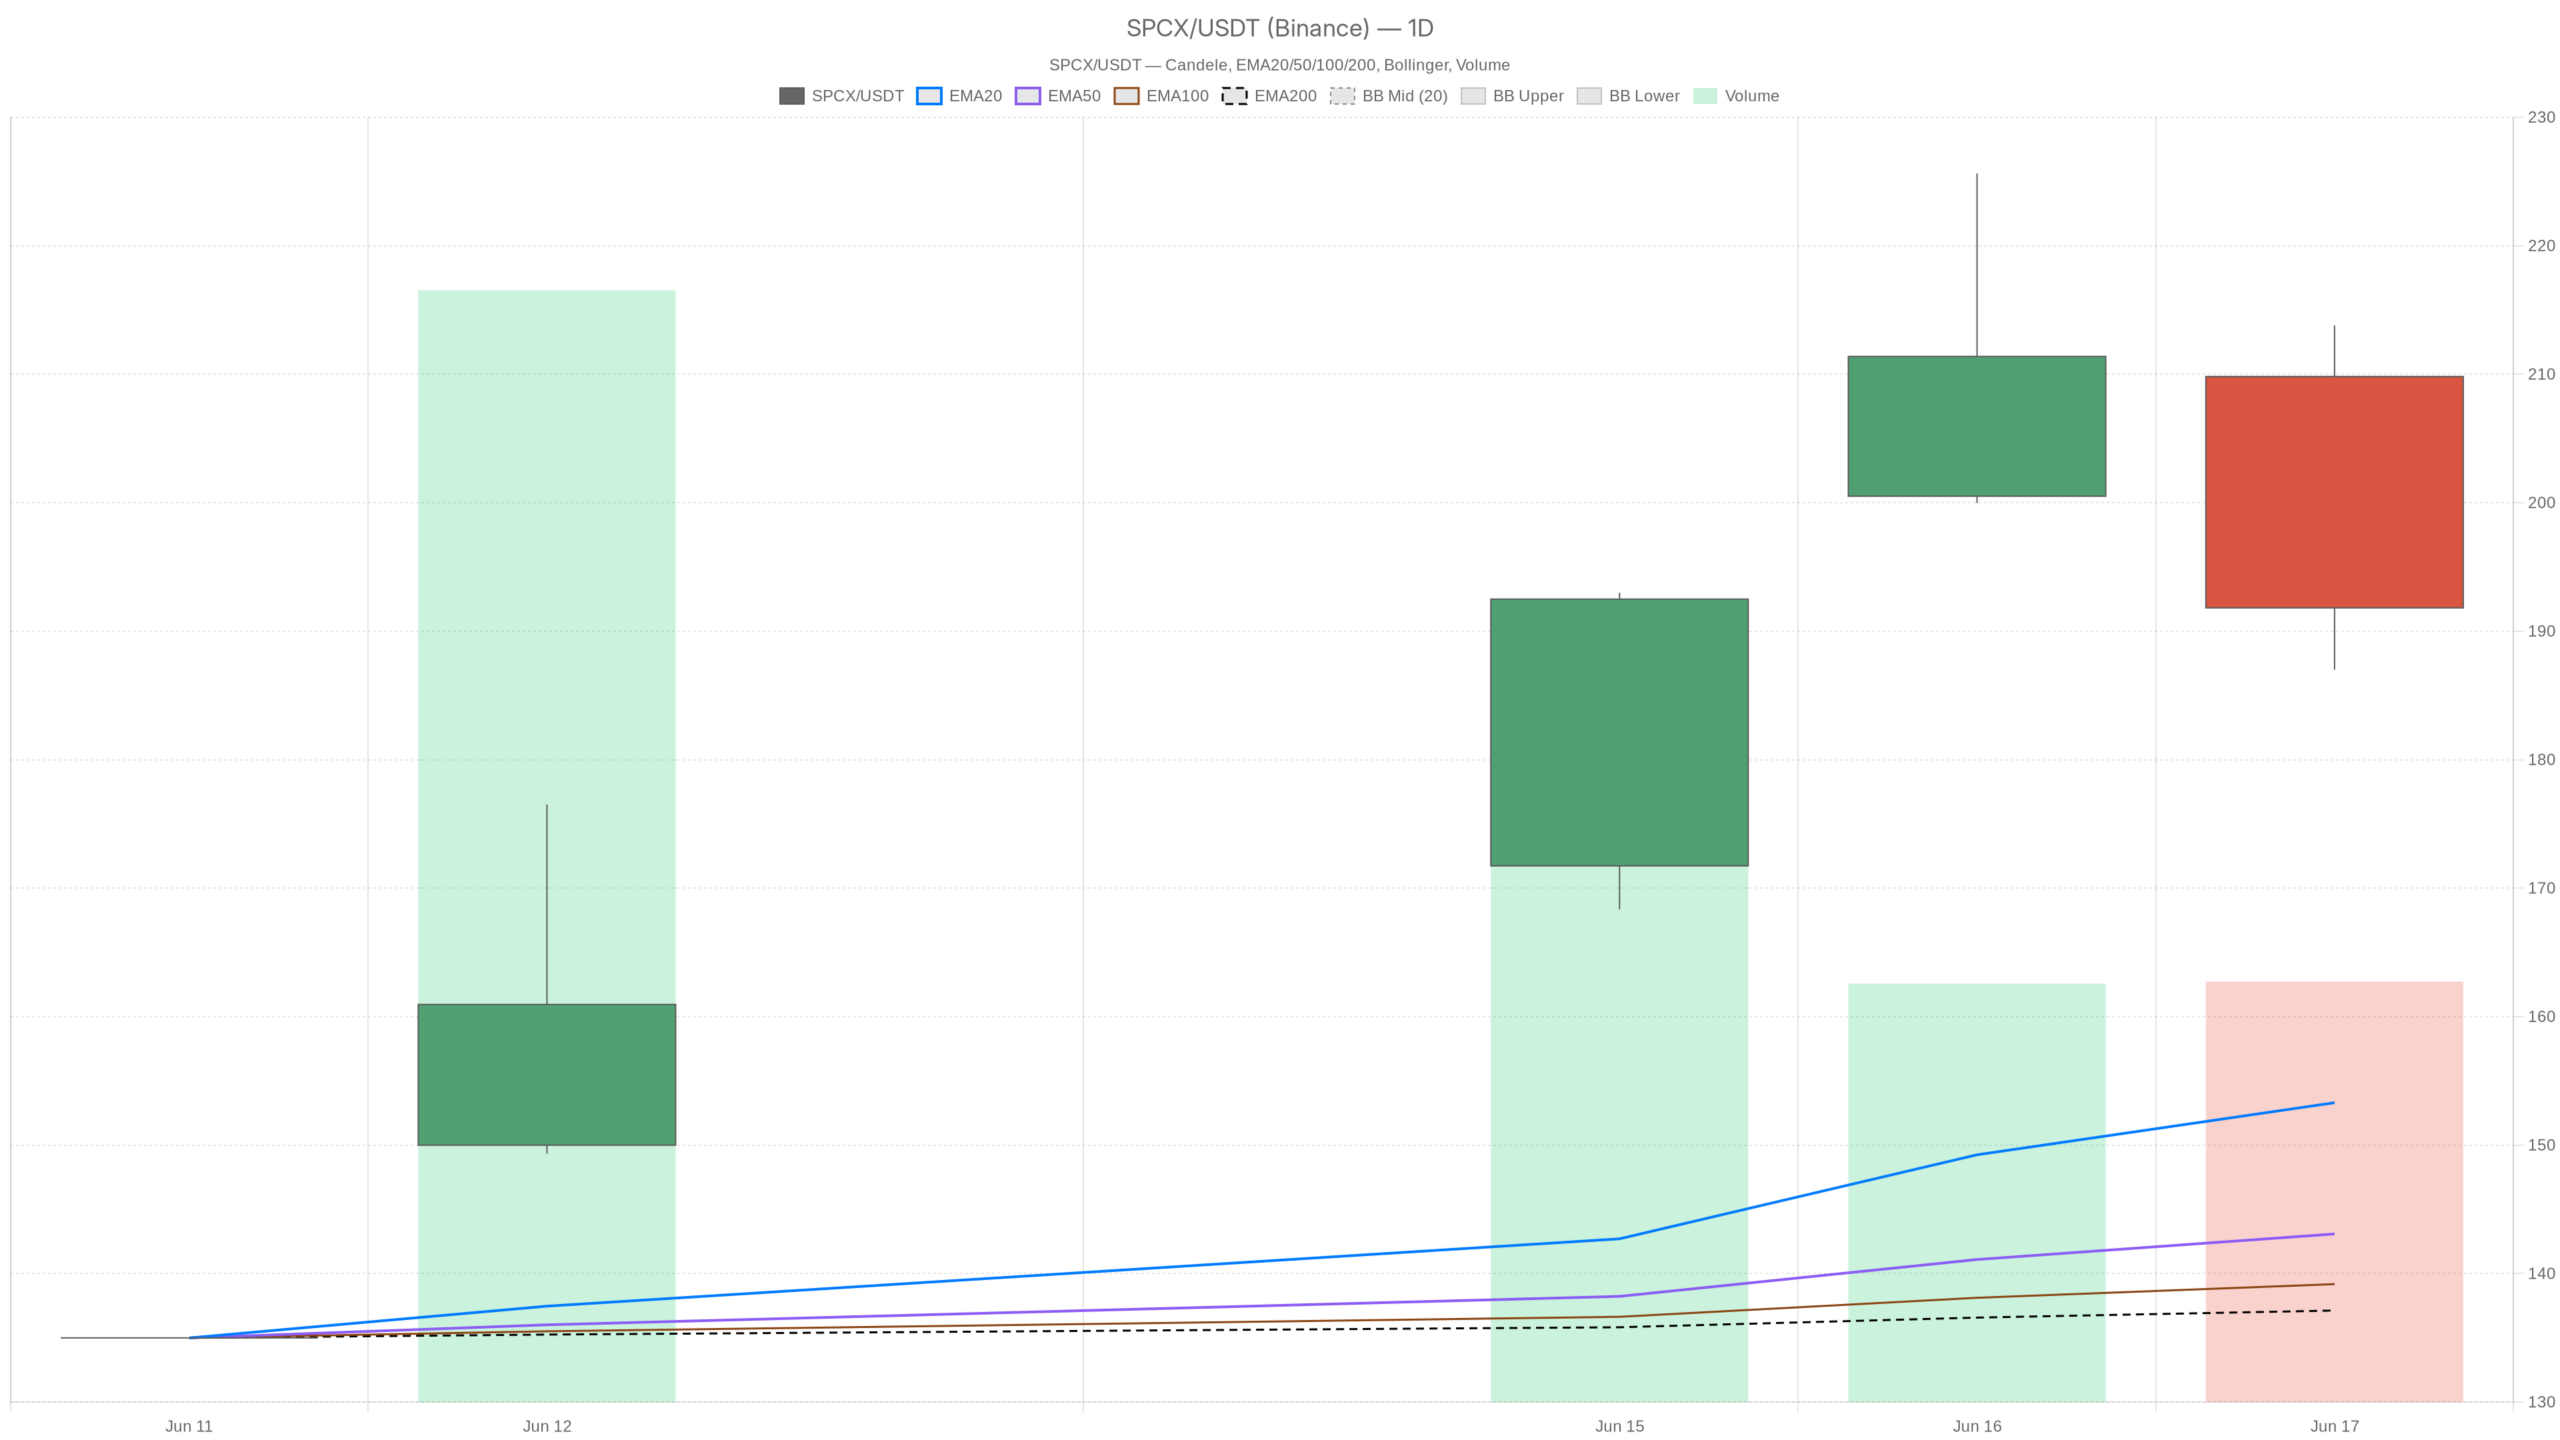
- SPCX closed at $191.82 on Wednesday after hitting a high of $213.80, marking its first pullback since the IPO.
- The daily EMA20 ($153.31), EMA50 ($143.09), and EMA200 ($137.13) remain in bullish alignment, confirming trend depth.
- Hourly MACD has turned negative at -2.11, signaling fading short-term momentum and a shift to neutral on the 1H chart.
- ATR14 sits at $10.42, meaning intraday swings of $10 or more are normal — tight stop-losses are not viable.
- SPCX options volume topped 1.6 million contracts on day one, trailing only Tesla and Nvidia among IPO debuts.
How is SpaceX Stock trending on the daily chart?
SpaceX Stock (SPCX) remains in a dominant bullish regime on the daily timeframe. Price closed at $191.82 after printing a high of $213.80. This wide-range session absorbed significant selling pressure. Yet the stock still finished well above all three major exponential moving averages.
Moving average alignment confirms trend depth
The EMA20 sits at $153.31, the EMA50 at $143.09, and the EMA200 at $137.13. That stacked alignment places price nearly $55 above the long-term average. This confirms the trend has real structural depth behind it. The configuration leaves little doubt about the dominant direction.
Daily momentum remains constructive
The daily MACD reinforces conviction. The MACD line sits at 12.81, well above the signal line at 5.30. The histogram of 7.51 remains broadly positive. At the macro level, momentum has not rolled over. Meanwhile, the daily pivot point at $197.54 acts as near-term reference, with R1 at $208.08 and S1 at $181.29.
Wednesday’s close at $191.82 places price between the pivot and S1. This is a mild short-term negative. However, it does not signal a structural breakdown.
What are the warning signs on shorter timeframes?
The 1H chart shows a clear momentum deceleration. The MACD line at 5.51 has crossed below its signal at 7.62. The histogram has turned negative at -2.11. This cross signals fading short-term momentum — not a reversal, but a noticeable cooling.
Hourly structure shifts to neutral
Price closed at $192.20, just below the hourly EMA20 at $193.54. The hourly RSI at 56.47 remains constructive, sitting in bullish territory without being overbought. It does not suggest panic. At the same time, it does not suggest urgency to buy the dip just yet.
Bollinger Bands reflect extreme IPO volatility
Notably, the 1H Bollinger Bands are extremely wide. The upper band sits at $220.59 and the lower at $172.98. The midband rests at $196.79, and price is trading below it. ATR14 at $10.42 on the hourly confirms that intraday swings of $10 or more remain entirely within normal range. Tight stops are not viable here.
15-minute chart shows near-term pressure
On the 15-minute chart, the RSI has fallen to 38.5, approaching oversold territory. The MACD histogram is negative at -0.24 and still declining slightly. Price sits below both the 15m EMA20 ($196.74) and EMA50 ($196.72), which have converged tightly. This structure often precedes a directional resolution.
The 15m pivot at $192.21 is being tested, with S1 at $189.99 serving as the immediate floor. A hold above $190 intraday would be a stabilizing signal.
What broader context matters for SpaceX Stock right now?
SPCX options volume topped 1.6 million contracts on the very first day. This trailed only Tesla and Nvidia among IPO debuts. That level of derivatives activity points to elevated speculative interest. It also raises the potential for sharp moves in either direction.
Meanwhile, reports indicate that SpaceX is pulling attention away from other space-sector names. This reinforces the stock’s dominance of the new space trade thematic.
What are the bullish and bearish scenarios for SpaceX Stock?
The bullish case rests on holding above the daily S1 at $181.29 while the daily EMA20 continues rising toward $155+. In contrast, the bearish case gains traction if price breaks below the $189–$190 support cluster, opening the door to a deeper retracement.
Bullish scenario
As long as SPCX holds above $181.29, the macro uptrend remains unchallenged. A recovery above the daily pivot at $197.54 would be the first step. Ultimately, a retest of the $208–$213 zone would signal that Wednesday’s pullback was merely healthy post-IPO consolidation. Renewed options flow and positive macro sentiment around space and AI ventures would further support this path.
Bearish scenario
The daily candle on June 17 opened at $209.82 and closed at $191.82. This represents a nearly $22 intraday reversal. That kind of wick signals real distribution at higher levels. On the other hand, if hourly momentum continues to deteriorate and price breaks below $189–$190, a deeper retracement toward $181 becomes probable. A breach of $181 would open the door to a more significant unwind of IPO-driven positioning.
FAQ
Is SpaceX Stock still in a bull trend after the pullback?
Yes. The daily chart remains firmly bullish, with price trading well above all three major EMAs and the daily MACD still positive. Wednesday’s decline was the first since the IPO and does not constitute a structural breakdown.
What key support levels should traders watch on SPCX?
The immediate support cluster sits at $189–$190, followed by the daily S1 at $181.29. A hold above $190 intraday would be a stabilizing signal, while a break below $181 would raise the risk of a deeper retracement.
Why are tight stop-losses risky with SpaceX Stock?
With ATR14 at $10.42 on the hourly chart, intraday swings of $10 or more are entirely normal for SPCX given its post-IPO volatility regime. Tight stops are highly likely to be triggered by noise rather than a genuine trend shift.
What does the record options volume mean for SPCX?
SPCX options volume exceeding 1.6 million contracts on day one signals elevated speculative interest. This heightens the probability of sharp moves in either direction and adds to the stock’s already high volatility profile.
Disclaimer: This article is for informational purposes only and does not constitute financial advice, an investment recommendation, or a solicitation to buy or sell any financial instrument or cryptocurrency. The analysis provided is not indicative of future results. Investing in crypto assets and financial markets carries a high risk of capital loss. Always do your own research (DYOR) and consult a qualified financial advisor before making any decision.
Article produced with the assistance of artificial intelligence and reviewed by the editorial team.